
- Voice of the private banker
- Connected strategy for wealth management
- The market for private wealth
- Private wealth’s value proposition
India has been a promising wealth management market for a while. The growing ‘middle class’ is part of folklore. The rich Indians may not be as ‘crazy’ as the Asians in terms of conspicuous consumption but the numbers have been growing steadily. So the prospects for the wealth management industry, as a whole, and the private wealth segment specifically have always been considered good.
Let’s see how good.
Defining the ‘high net worth’
Wealth usually means ‘net worth’ which, of course, means total assets minus liabilities.
However, since the wealth management industry can’t manage clients’ primary homes, it has been customary to exclude the value of the primary home from the calculation and instead use the concept of ‘investable assets’. Hence, the industry tends to segments individuals, or sometimes households, into three broad groups –
- Retail: investable assets of between up to $100,000 (while some use up to $250k)
- Affluents: investable assets of between $100,000 and $1 million
- High net worth individuals (HNWI): investable assets of over $1 million
Traditionally a UHNW segment has been carved out for wealth over $30 million, but lately some reports divide HNW more finely as –
- Lower end of high net worth individuals (HNWI) I: between $1 million and $5 million
- Lower end of high net worth individuals (HNWI) II: between $5 million and $20 million
- Upper end of HNWI: between $20 million and $100 million
- Ultra high net worth individuals (UHNWI): more than $100 million
Note these are arbitrary definitions, like many other concepts in finance. The Indian industry uses lower thresholds, as we will learn from the interviews with industry experts. However, at this stage, we need to be aware of the global definitions as we use market sizing data from global wealth reports.
The wealth reports
Many institutions produce ‘wealth reports’ estimating household wealth, mostly for broader purposes. We will try to keep the discussion on the HNW or ‘wealthy’ wherever possible. The most commonly cited reports are listed below –
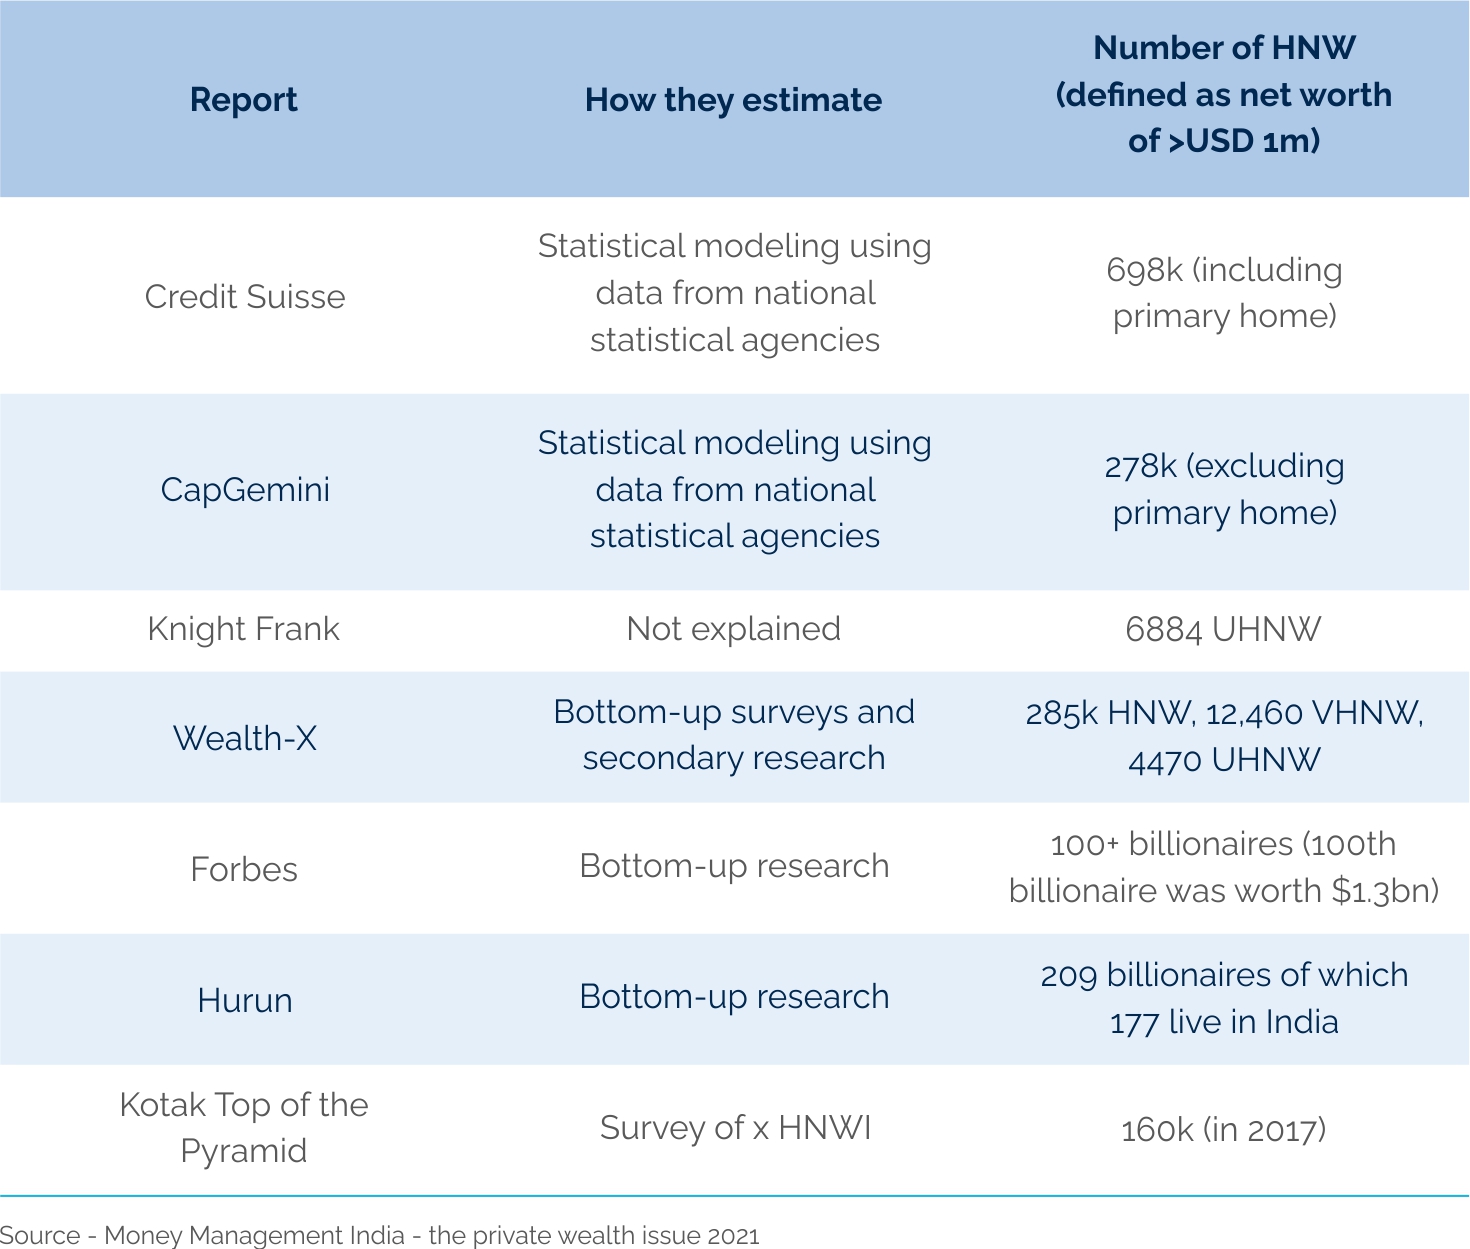
The Credit Suisse Global Wealth Report, one of the widely quoted reports, uses statistical techniques to estimate household wealth. Note Credit Suisse (CS) is different from other wealth reports in that it includes ‘total wealth’, including owner-occupied primary homes while others focus on ‘investable’ assets only. Secondly, it also includes the market value of pension assets while most others don’t.
Lastly, CS adjusts the shape of the wealth distribution at the upper end. It uses data from the Forbes annual global list of billionaires to improve the estimates of wealth holdings above USD 1 million, and then uses ‘well-established statistical techniques’ to estimate the intermediate numbers in the top tail. This produces ‘plausible values’ for the global pattern of asset holdings in the HNW and UHNW categories.
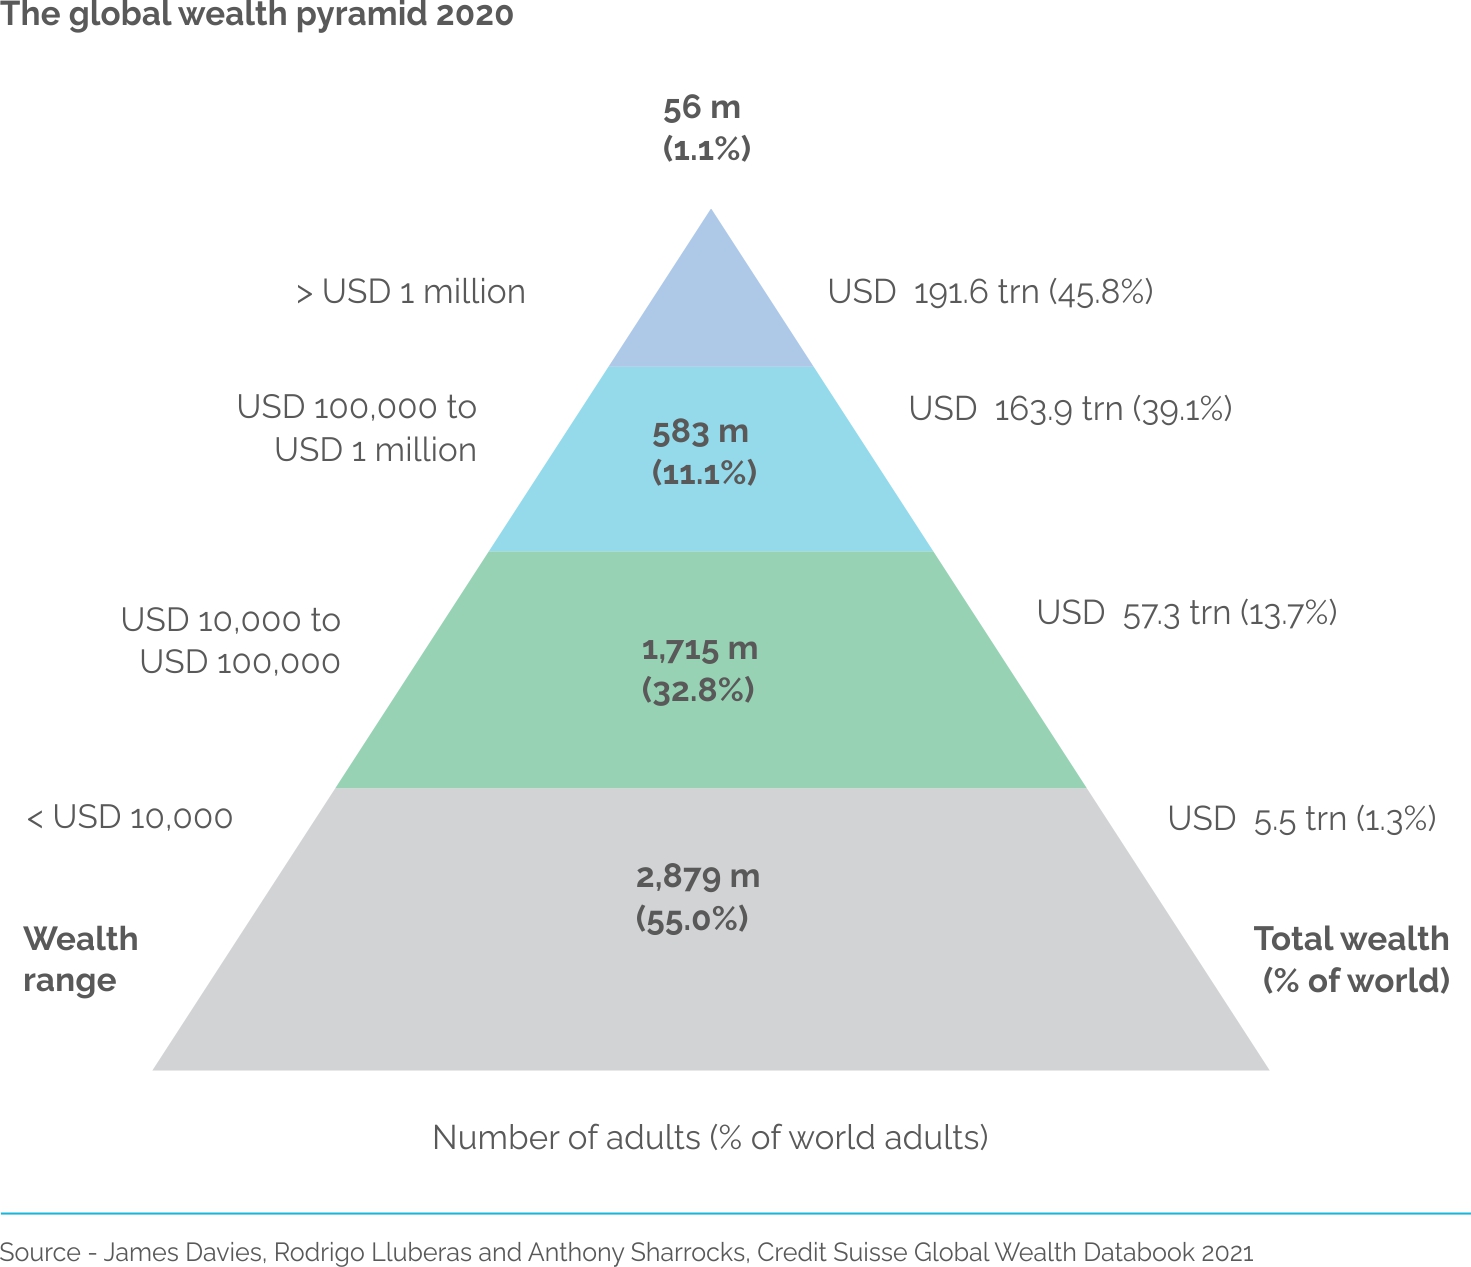
CS draws the global wealth pyramid as having 4 segments. The top tier of the wealth pyramid is the high net worth (HNW) individuals i.e. USD millionaires. This segment includes 56 million people globally or 1.1% of all adults, yet owns 46% of global wealth.
The report highlights the general trend of wealth inequality rising and then declining in the early years of the century. India is one of the few notable exceptions to this trend – wealth inequality has been increasing steadily. CS attributes this to the increasing share of financial assets in household wealth.
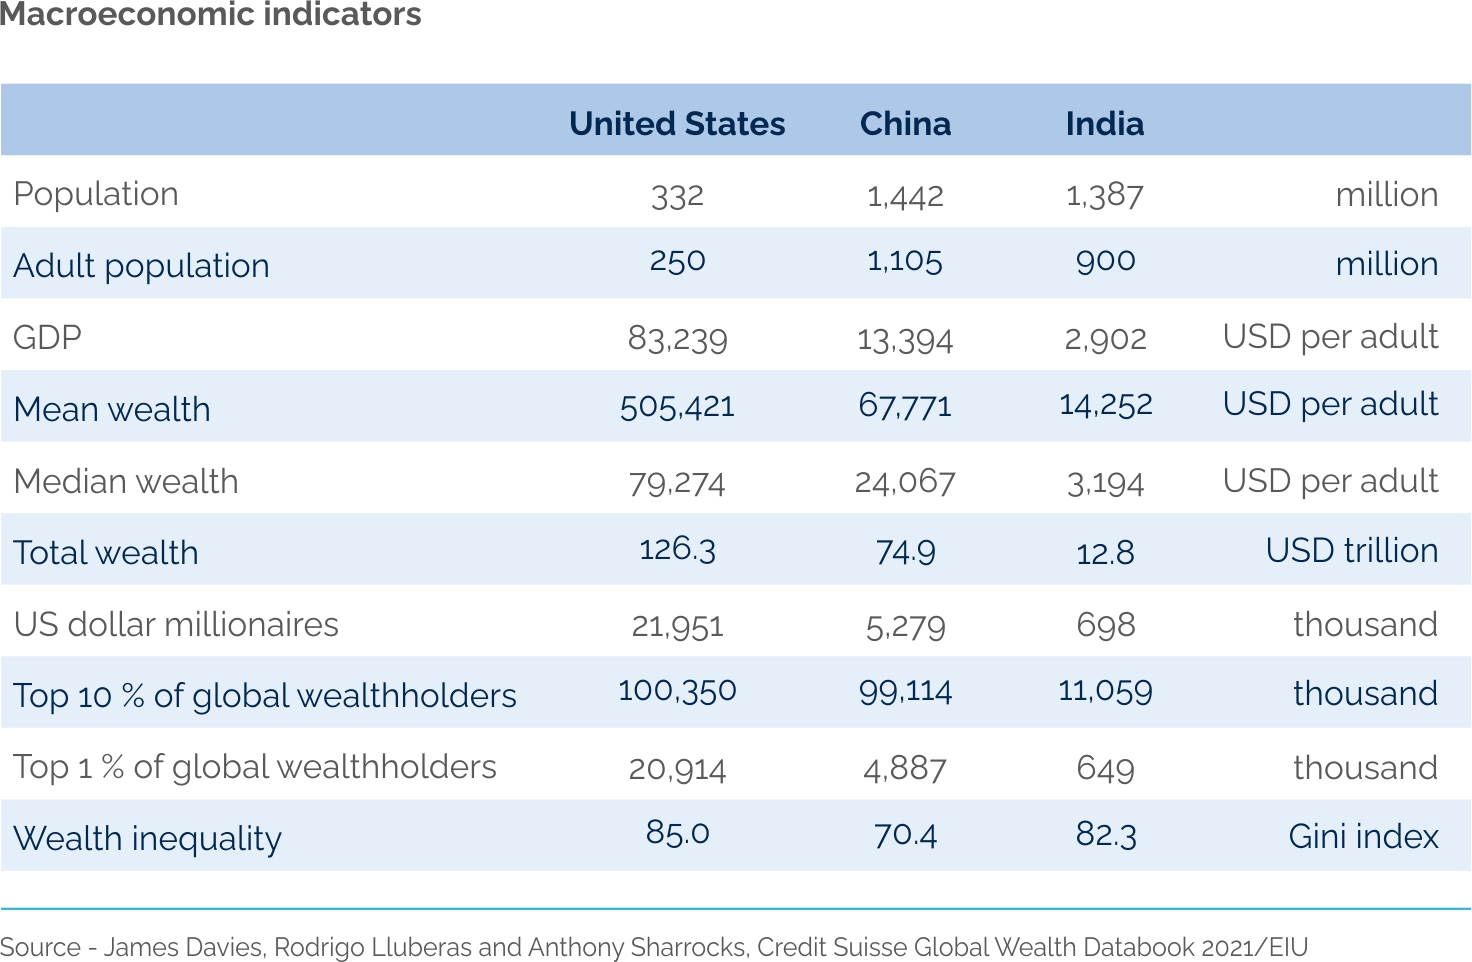
As is expected of a developing economy, India’s population is skewed towards the lower end of the wealth spectrum with only 0.1% of the population making the ‘dollar millionaire’ definition. With about 698,000 adults, India is home to 1% of the USD millionaires. This number is 66,000 lower than the previous years because the value of wealth fell during 2020.

The widely-quoted CapGemini World Wealth Report has been an annual publication for 25 years. CapGemini also estimates the size and growth of total wealth by market using national account statistics, and the distribution of this wealth across the adult population in that market using a wealth/income relationship formula and Lorenz curves. Financial assets are captured at book value and then adjusted using stock indices returns. Investable wealth figures include financial assets and exclude collectibles, consumables etc along with primary residences.
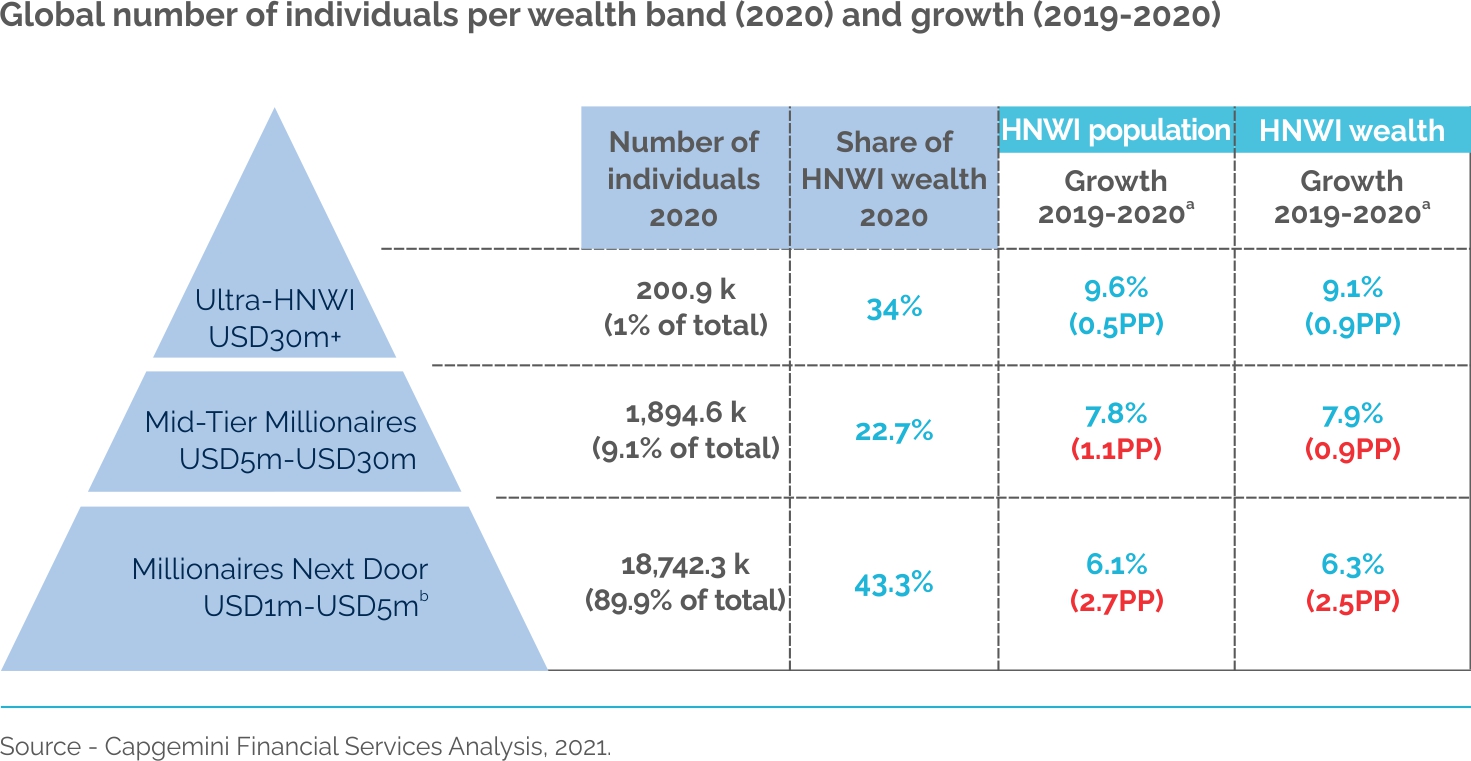
The 2021 edition of the report estimated that after five years, North America overtook Asia-pacific in HNWI population and wealth, in part helped by the stellar performance of leading US stocks, in turn due to the massive stimulus.
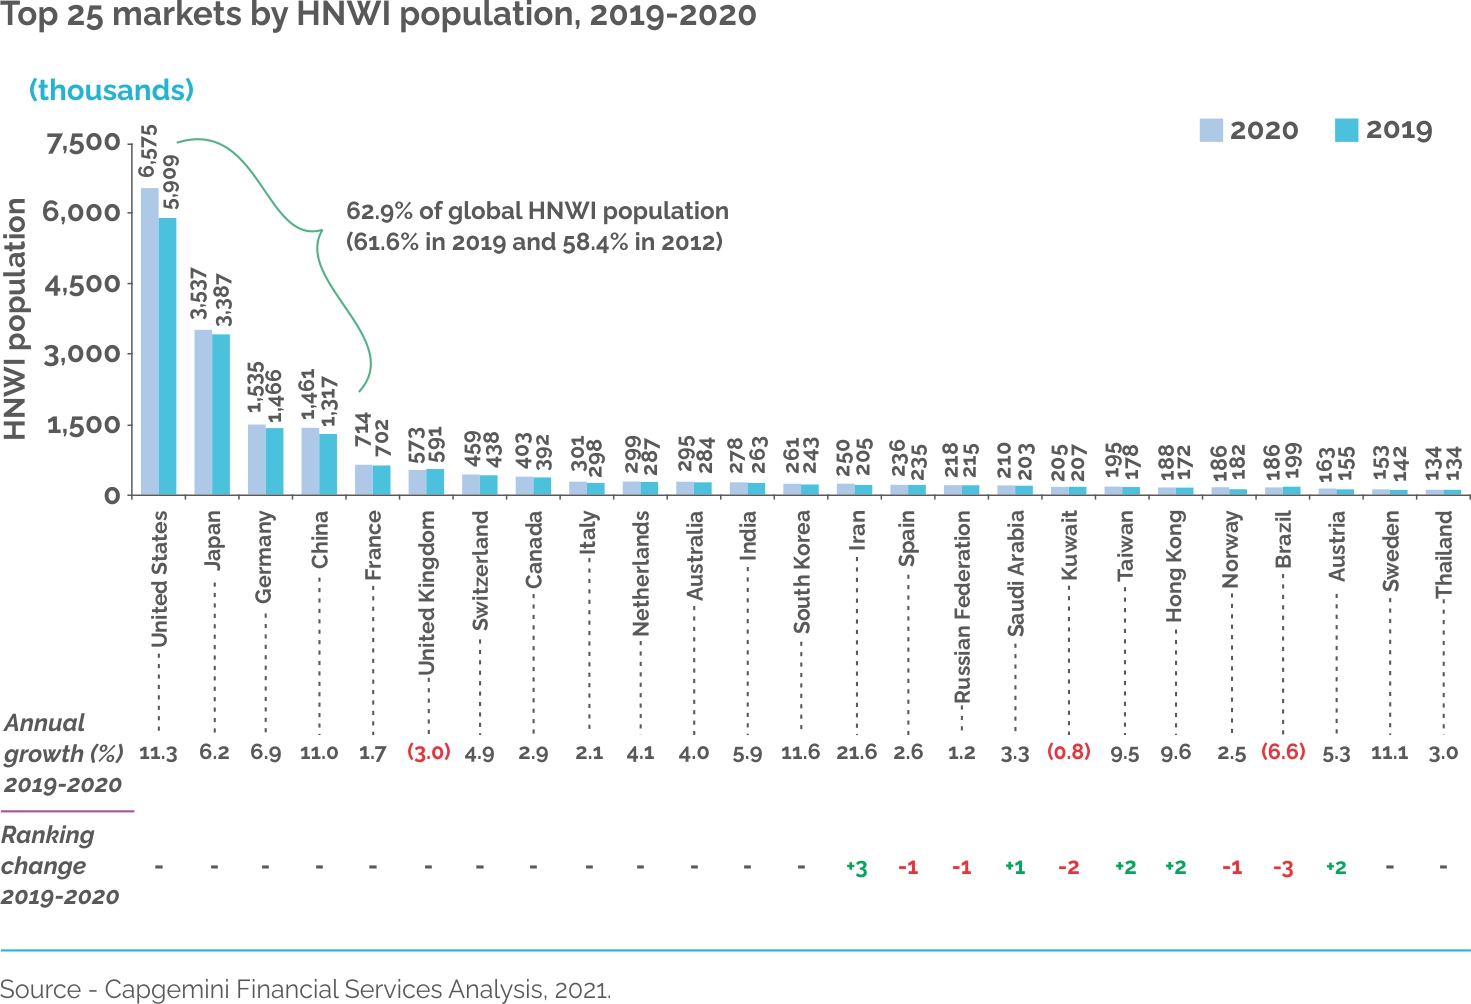
Using the narrower definition, CapGemini estimated there were about 263,000 HNWI in 2019 and 278,000 in 2020 in India.
India represents around 4.3% of the overall population of HNWI in Asia Pacific, similar to that of Australia, while Japan makes up about 51% and China 20%. India has shown one of the fastest growth rates for HNW population – about 20.4% compared to 15% for the rest of Asia-Pacific. However, last year this growth rate dropped to 5.9% – behind the leaders China, Taiwan, Hong Kong and South Korea.
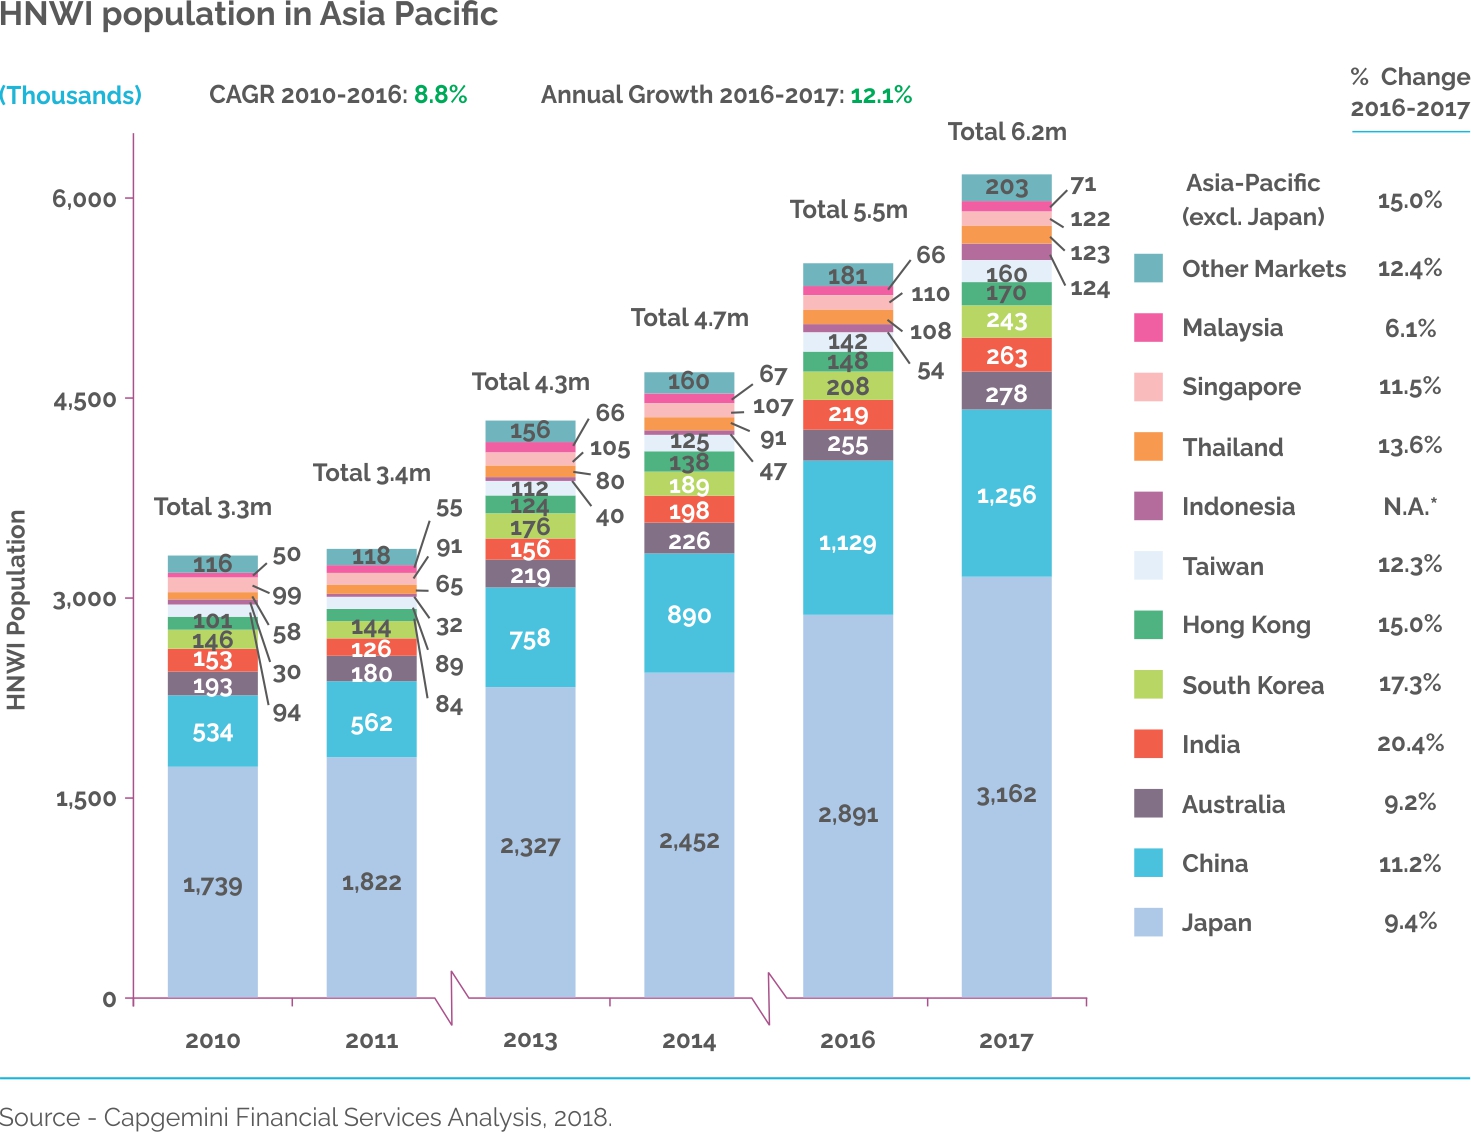

The wealth owned by the 263k HNWI in India added up to USD 1.07 trillion in 2019 and has grown at the highest rates in the region.
Kotak’s Top of the Pyramid Report estimated the wealth of the 160,600-odd HNWI to be closer to USD 2 trillion in 2017 (~ INR 153 trillion using conversion rate of INR 73 per USD).

Let’s now take a closer look at the UHNW population.
Segmenting HNWs – Ultra high net worth (UHNW)
Using the definition of Ultra high net worth (UHNW) being worth $50m, CS estimates India has 4,320 UHNW individuals.

Boston Consulting Group (BCG) puts a higher bar for the ‘Ultras bracket – individuals whose total financial wealth exceeds USD100 million. It estimates India appears at number 6 with 8,000 people worth about USD 1.1 trillion, out of the global total of about 60,000 people with a combined wealth of USD 22 trillion.

Segmenting HNWs – Billionaires
Taking the segmentation even finer, the term ‘billionaire’ is self-explanatory – people worth USD 1 billion. In this segment, the Forbes list is regarded as one of the most reliable. Forbes estimates there are 39 billionaires in India as at March 2020. This compares to 358 in the US and 142 in China.
Wealth-X, a specialist information provider on the wealthy, published a similar list of countries but estimated the numbers of billionaires to be higher in all of them. It pegged Indian billionaires to around 87.

Indeed, Wealth-X estimates that there are 39 billionaires in Mumbai alone.

Conclusion – the market is big and growing
The main customer for a private wealth management firm is a high net worth individual or household. Based on various estimates, there are probably around 250,000 such potential customers in India. The growth in numbers and assets of such customers is bound to keep growing at a decent clip with the increasing share of financial services – firstly in terms of entrepreneurs ‘unlocking’ their businesses through sales or IPOs, and then, through investing sale proceeds through financial assets.
While the number of HNW in India was growing at a scorching pace, part of the faster Asia pacific growth rate, the pandemic may have changed this trajectory.
If we include a wider range of customers including the ‘affluent’ segment, the market is significantly bigger. In addition to a wider range of individuals, private wealth firms also advise institutional investors such as corporate treasuries, not-for-profit foundations, even exempt provident funds. In other markets, such institutions would be served by investment consulting firms.


You must be logged in to post a comment.