ISIN INF174V01945
Overall Analysis
The fund’s 1-year rolling returns and IR indicate that the fund outperformed the index, and is among the top-performing funds. A short-term outperformance of the fund shows the fund’s performance compared to the benchmark.
Performance Analysis
Rolling returns in quartiles
The rolling return chart shows excess 3-year annualized returns in the context of peer return quartiles. The blue line’s time above the third green median line indicates the fund’s better than the median performance of the benchmark.
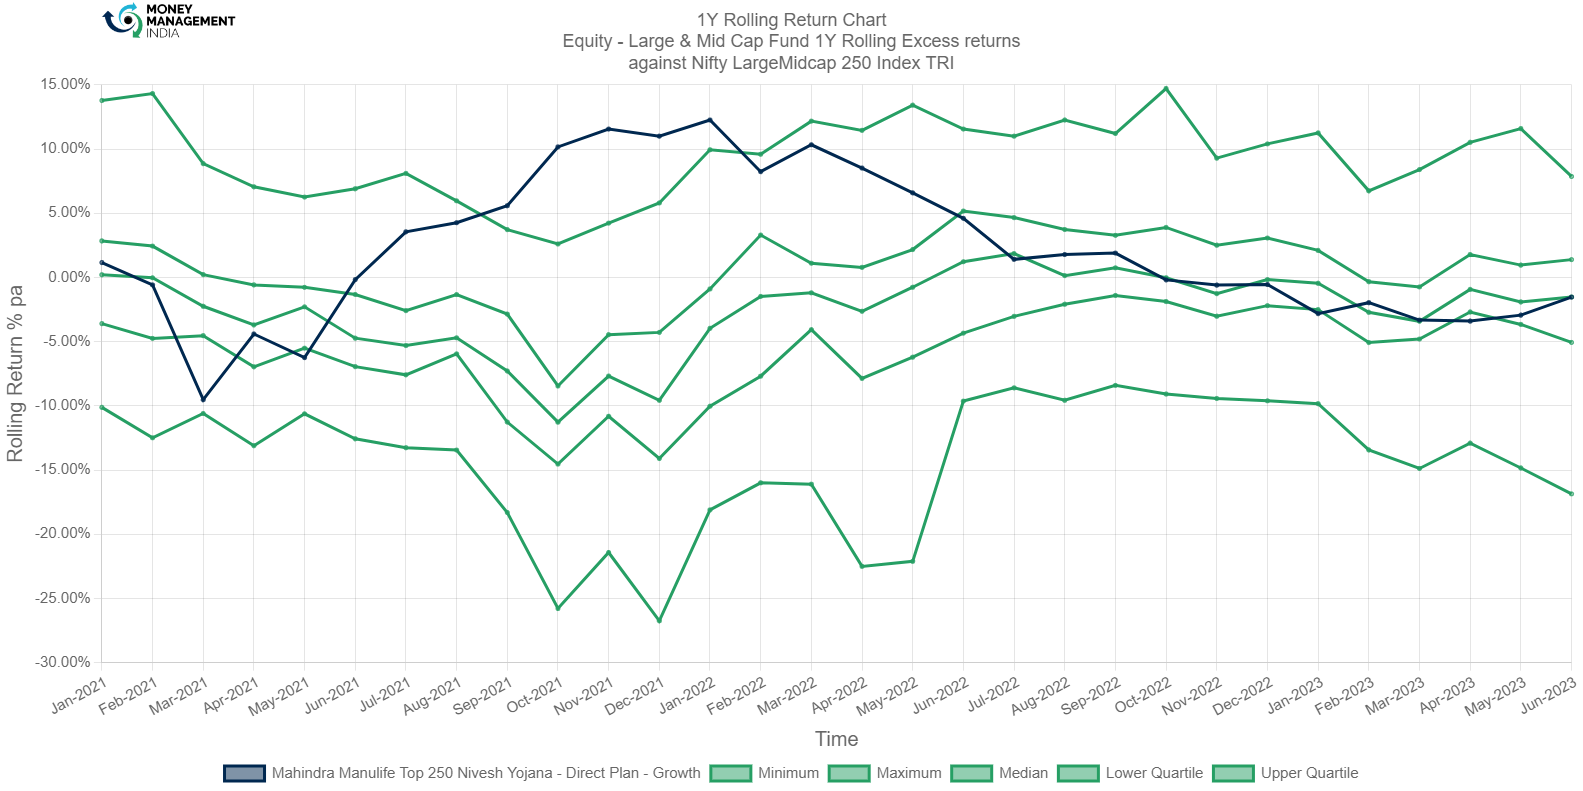
Although the fund’s 1-year rolling return performed better than the median it is still in the below-average region. From May 2021 – Oct 2022 the fund outperformed the benchmark with returns ranging between -6.25%-12.26%. The fund currently matches with the median and the return of -1.54% in June 2023.
Rolling Risk/return (snail-trail)
The rolling risk/return chart shows excess 3-year annualized returns relative to the index. The top left quadrant would indicate higher returns with lower volatility than the index.
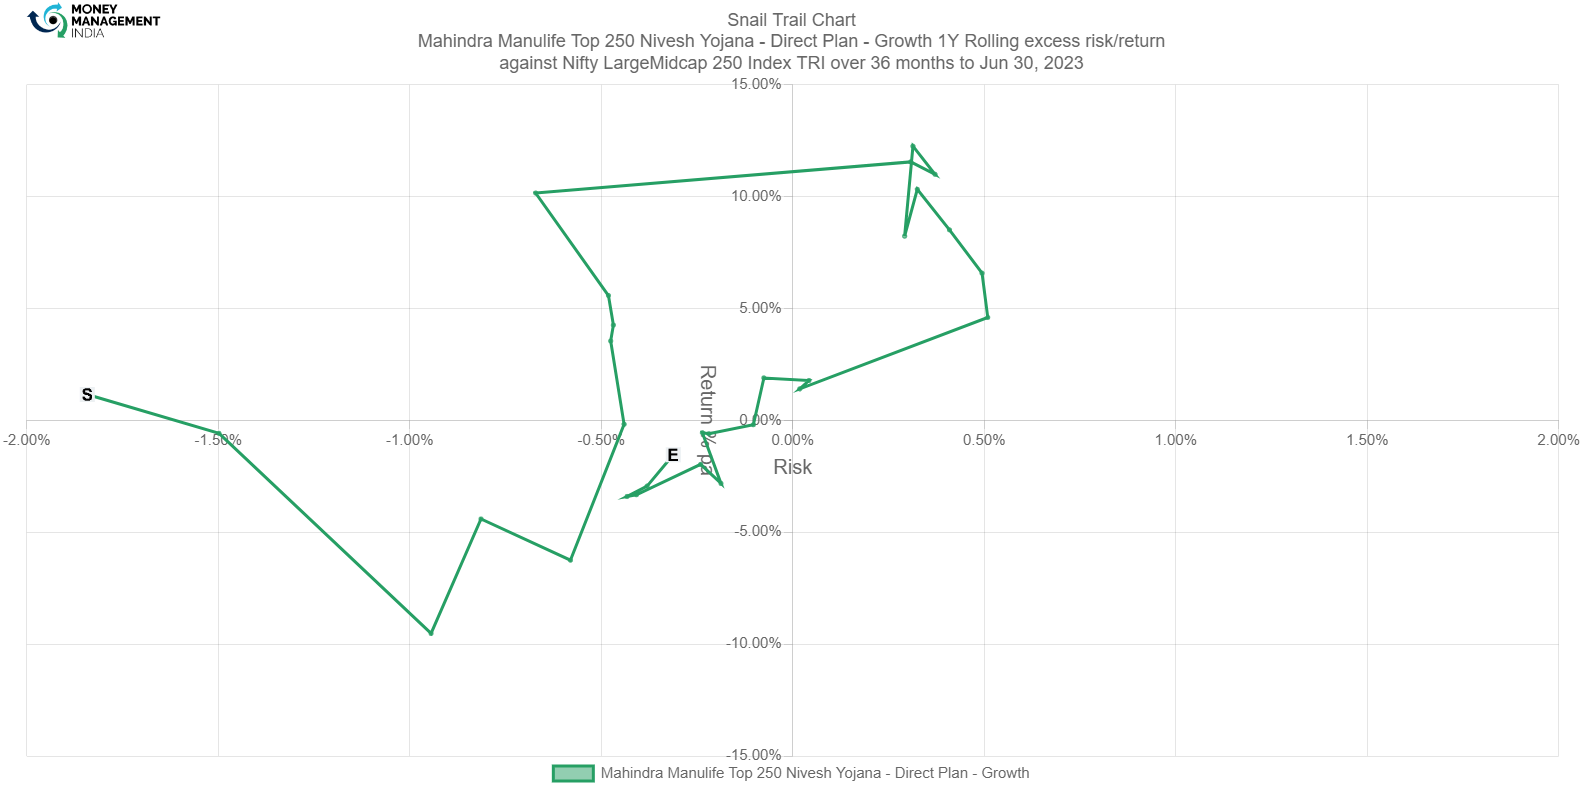
Snail trail analysis shows that the fund’s performance compared to the index is good. The fund earned good returns with low-risk levels between -1.8%- 0.50%.
Tracking Error
The tracking error chart shows how the fund ‘tracks’ against the index. The higher the TE, the more active the fund’s return has been, with the 2-4% range considered to be barely active, the 4-6% range considered to be reasonably active, and anything higher attributed to concentrated/focused funds. Funds with TE of less than 2% can be considered to be closet indexers.
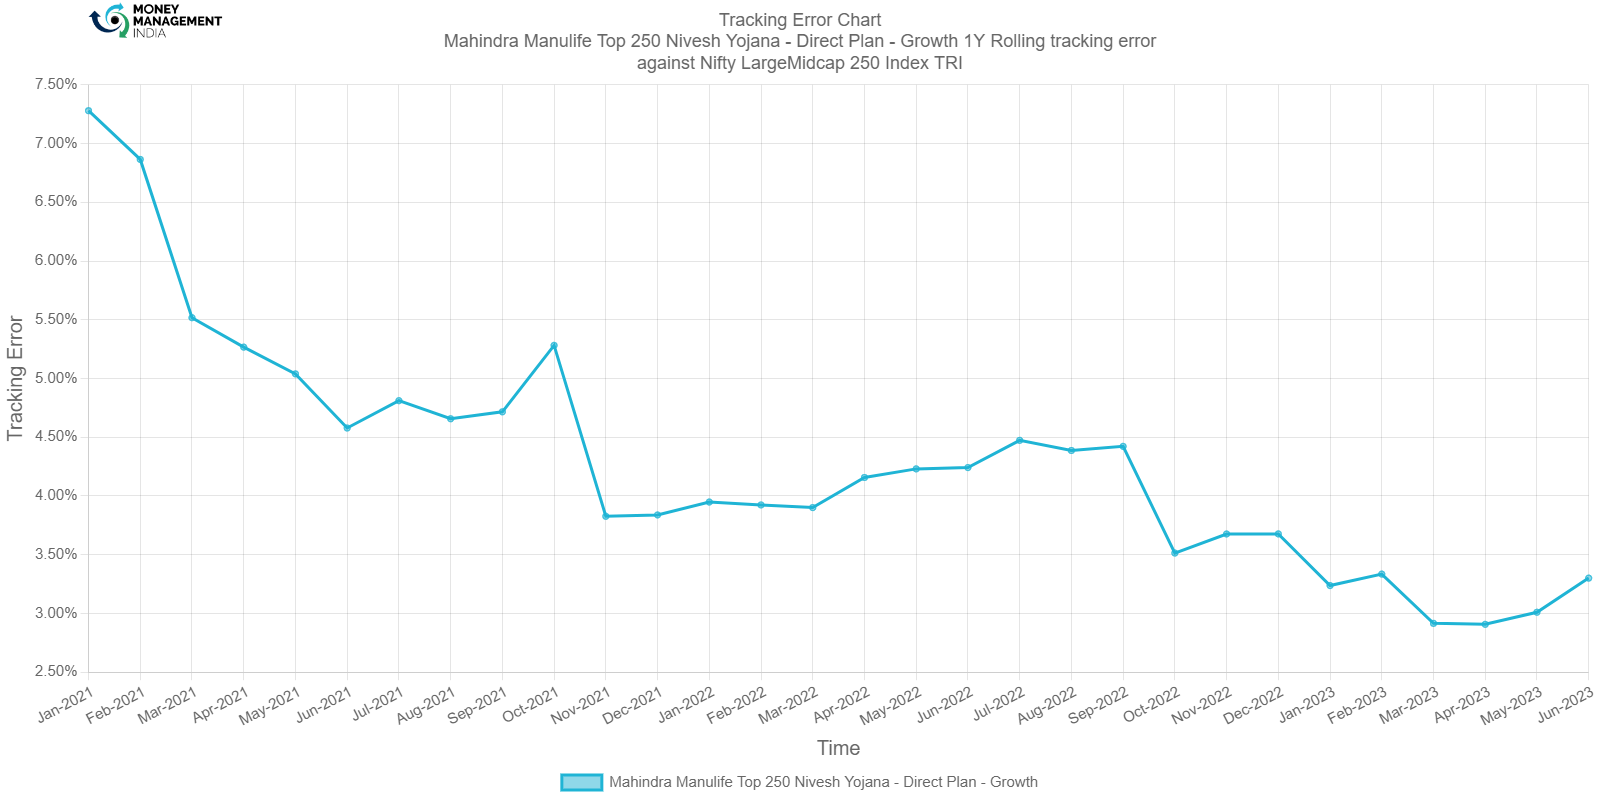
The fund has constantly maintained an active tracking error throughout late 2022 and till early 2023. A gradual increase can be seen from April 2023, this indicates that the fund is active. The average TE range is between 3-5.5%.
Information Ratio
The information ratio is a measure of risk-adjusted return as its excess return per excess unit of volatility. Active funds must have an IR higher than 1, higher than 1.3 is considered ideal.

The IR reached a peak of 3.1050 in January 2022. The decrease in IR indicates that the risk-adjusted returns are decreasing or the management could have opted for a passive approach. IR dropped down to -1.1700 in April 2023 and seems to be gaining its momentum in June 2023 at -0.4650.
Portfolio analysis
Stock style chart
Morningstar’s stock style chart shows the ‘style’ of the stocks in the portfolio in terms of size and value/growth style. The centroid shows the weighted average while the zone circle shows how varied the stock styles are.

The growth-oriented fund maintains an asset class that correlates with the category but does have a significant diversification range among them. Growth and blended are given higher weightage in both Large and midcap stocks. A small number of value stocks from large have to be taken into consideration.
Factor profile chart
Morningstar’s factor profile shows the historical style analysis of the stocks in the portfolio in terms of size, value/growth style, and other key factors. The blue circle shows the fund relative to the black dot for the category average.

The growth-oriented fund has provided some level of yield but capital appreciation is better than the category average. The fund has better-quality stocks with low volatility and liquidity. The fund’s capital size is mid.
Prepared by Sai Mahesh, August 2023
You must be logged in to post a comment.