ISIN INF174K01LF9
Overall Analysis
The fund’s performance against its benchmark is good. Both short-term and long-term performance looks good in the sense of rolling returns and Information ratio. The Tracking error indicates that the very active management improved the returns in the long run.
Performance Analysis
Rolling returns in quartiles
The rolling return chart shows excess 3-year annualized returns in the context of peer return quartiles. The blue line’s time above the third green median line indicates the fund’s better than the median performance of the benchmark.
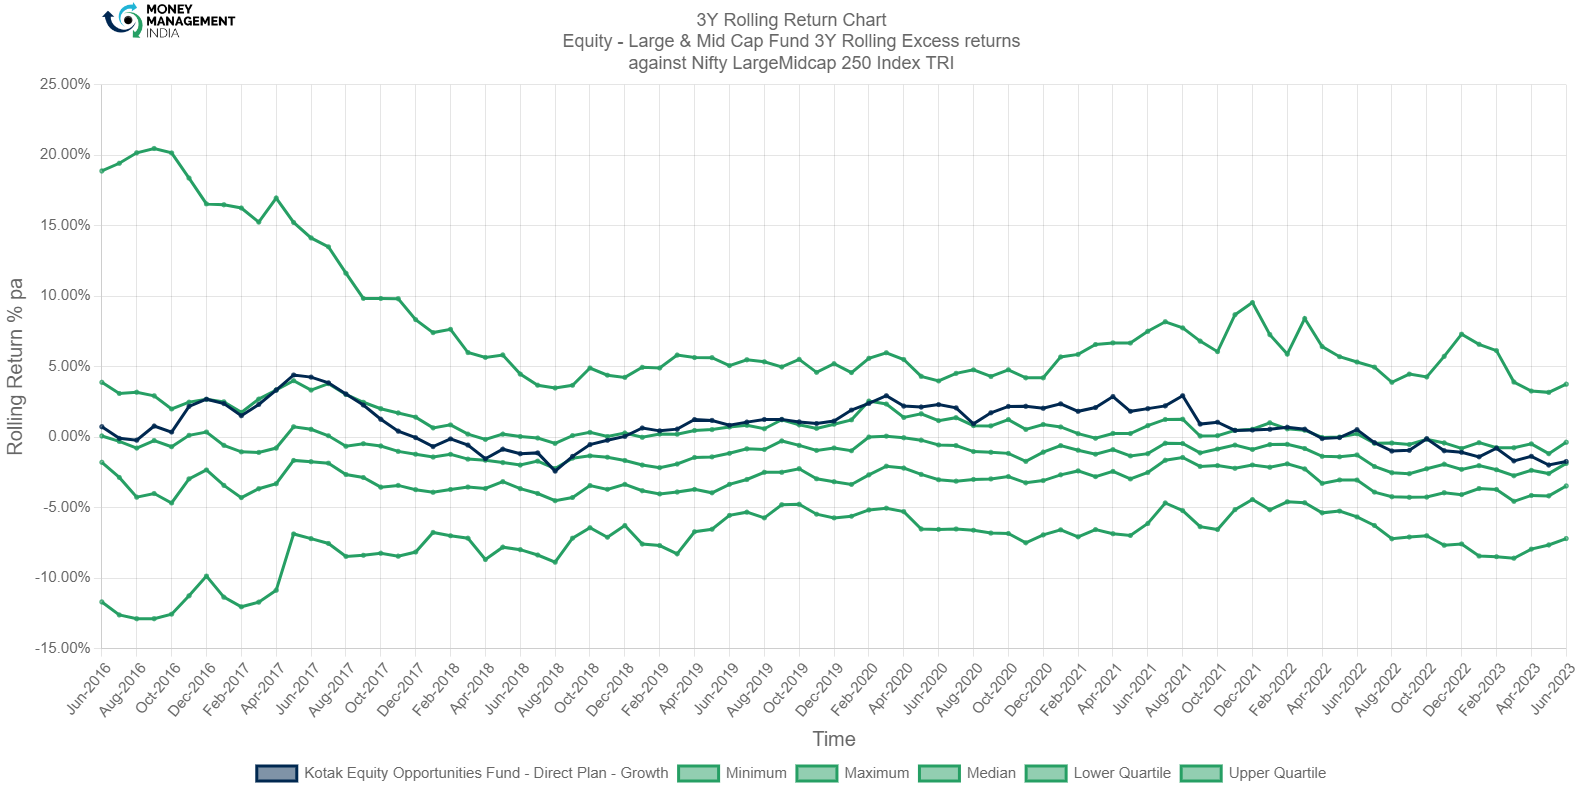
The fund outperformed the median on a constant basis but generated returns below 5%. The fund had a good performance from Aug-2018 till Jun-2022. Then, the fund’s performance streak dropped down to a minimum level by Dec-2021. Average performance is between -2.40%- 4.4%.
Rolling Risk/return (snail-trail)
The rolling risk/return chart shows excess 3-year annualized returns relative to the index. The top left quadrant would indicate higher returns with lower volatility than the index.

This fund has shown good 3-year returns. The fund generated returns maximum up to 4.44%. However, the high performance came down to underperforming the index by March 2022. 3-year rolling returns as of June 2023 is -1.73% and risk is -1.837%.
Tracking Error
The tracking error chart shows how the fund ‘tracks’ against the index. The higher the TE, the more active the fund’s return has been, with the 2-4% range considered to be barely active, the 4-6% range considered to be reasonably active, and anything higher attributed to concentrated/focused funds. Funds with TE of less than 2% can be considered to be closet indexers.
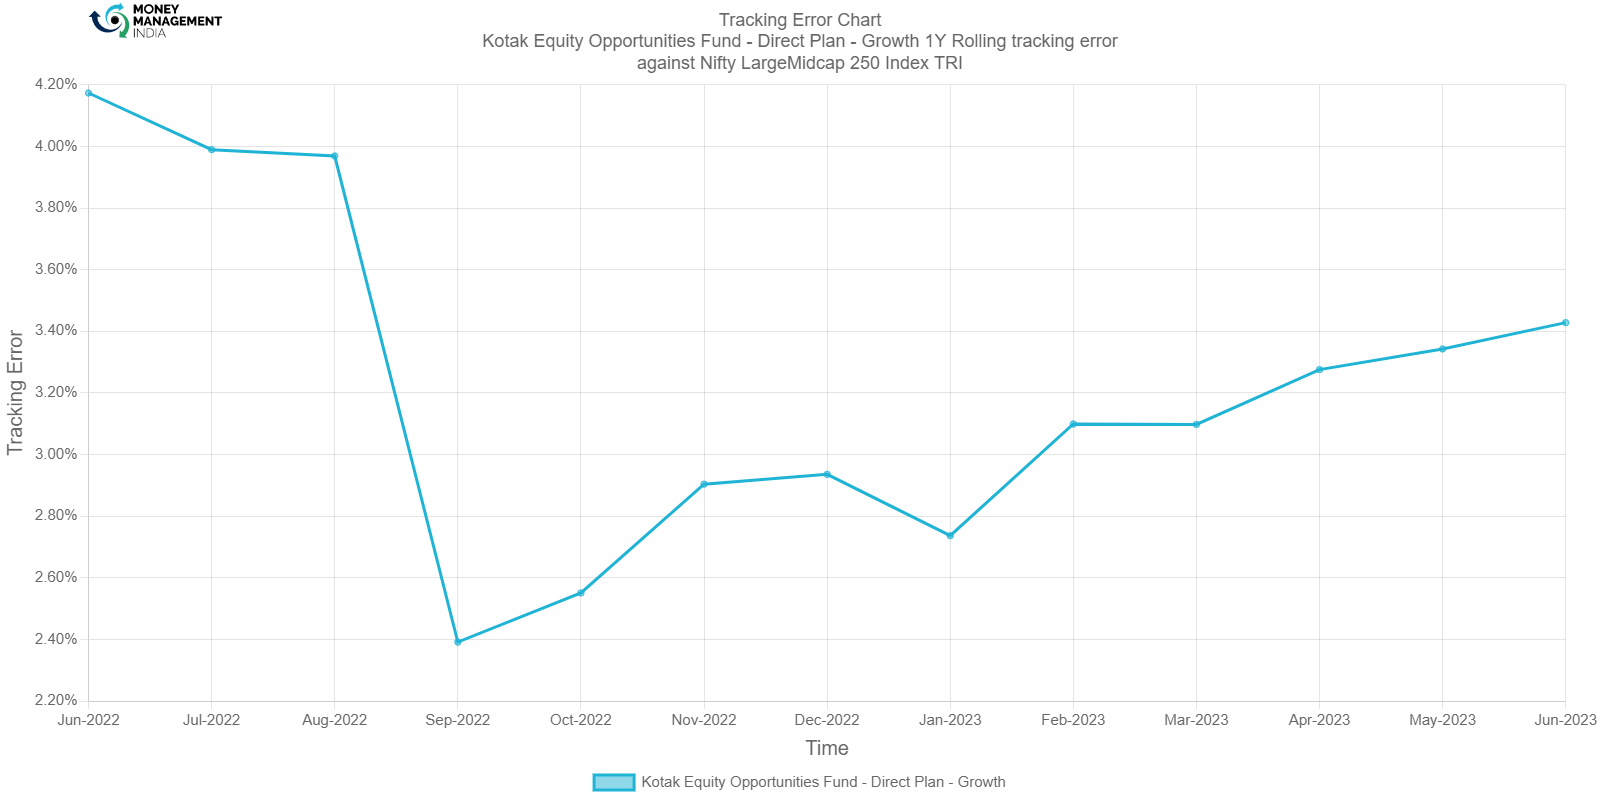
The TE was around 4.17% in June 2022. The active fund also maintained a tracking error between 2-3.50% from Sep 2022 till Jun 2023. Then, the drop in TE indicates that the fund started following a passive approach.
Information Ratio
The information ratio is a measure of risk-adjusted return as its excess return per excess unit of volatility. Active funds must have an IR higher than 1, higher than 1.3 is considered ideal.
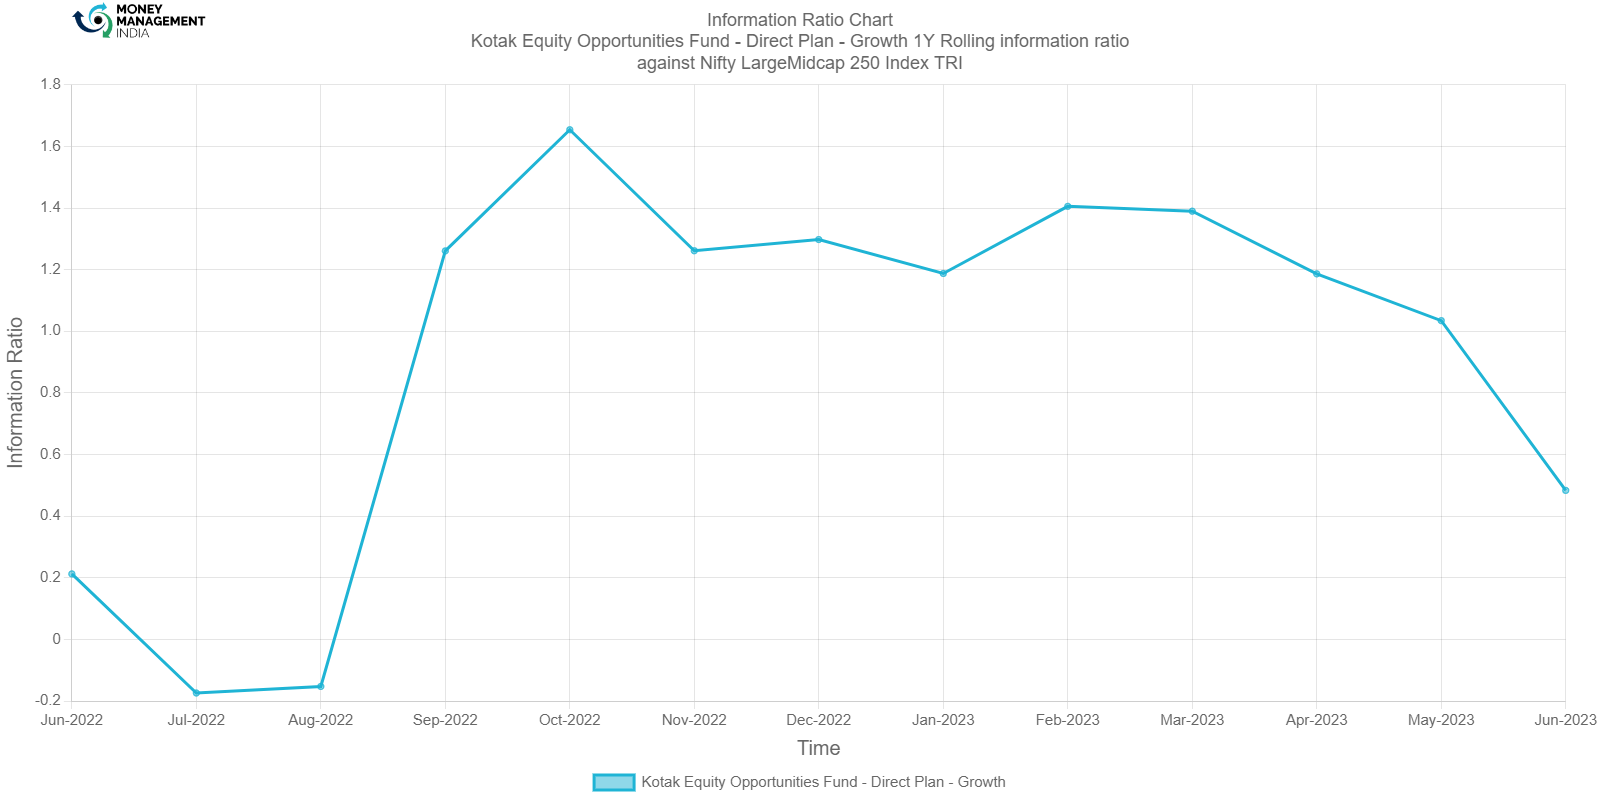
The IR reached a peak during Oct-2022 with 1.6540. Then, IR dropped continuously till it reached 1.310 on Nov-2022. The fund then reached the peak of 1.4 on Feb-2023. Currently, the fund has an IR of 0.4840.
Portfolio analysis
Stock style chart
Morningstar’s stock style chart shows the ‘style’ of the stocks in the portfolio in terms of size and value/growth style. The centroid shows the weighted average while the zone circle shows how varied the stock styles are.

The fund closely tracks the index and maintains a combination of blended and growth large-cap stocks. A few Midcap blended stocks and a couple of large cap value stocks.
Factor profile chart
Morningstar’s factor profile shows the historical style analysis of the stocks in the portfolio in terms of size, value/growth style and other key factors. The blue circle shows the fund relative to the black dot for the category average.
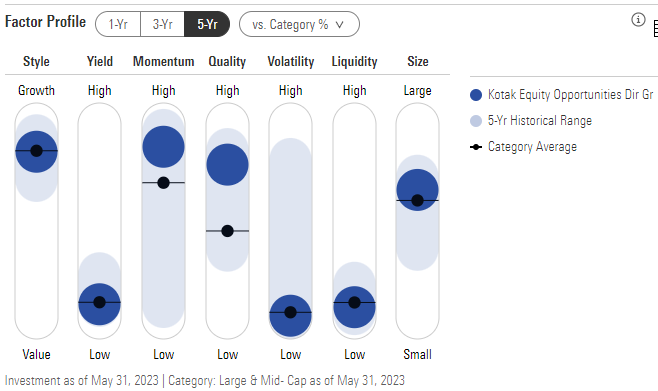
Even though blended stocks have higher weightage in asset allocation, the style factor shows growth. The fund has a low yield and high capital appreciation. The fund’s asset is more profitable than the category average. Low volatility and liquidity show the fund is growth-oriented. The fund’s capital size is moderately large.
Prepared by Sai Mahesh, August 2023
You must be logged in to post a comment.