ISIN INF582M01GA0
Overall Analysis
The 1-year rolling excess returns show the fund performed with lower risk, the fund is moderately active according to TE. IR shows that the fund returned less risk-adjusted returns.
Performance Analysis
Rolling returns in quartiles
The rolling return chart shows excess 3-year annualized returns in the context of peer return quartiles. The blue line’s time above the third green median line indicates the fund’s better than the median performance of the benchmark.
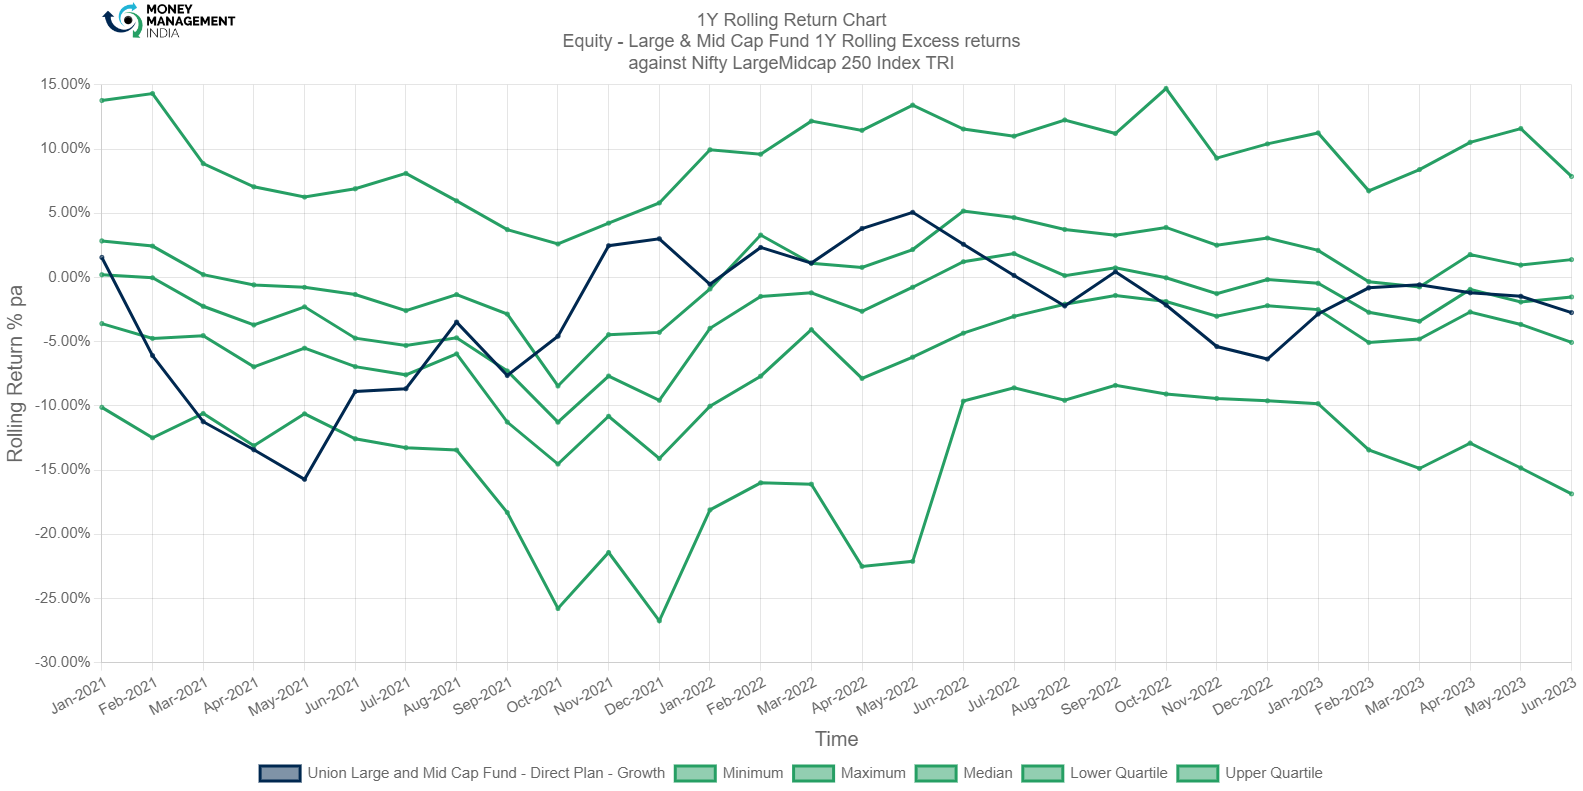
The fund performed lower than the lower quartile till May 2021 at a -15.72% return. It started gaining upward momentum from Jun-2021 till Jun-2022 with returns ranging between -8.6%- 5%. The fund lost its momentum and the downfall lasted till Dec-2022 and the fund recovered from Jan-2023. The fund’s 1-year rolling return in Jun-2023 is at -2.74%.
Rolling Risk/return (snail-trail)
The rolling risk/return chart shows excess 3-year annualized returns relative to the index. The top left quadrant would indicate higher returns with lower volatility than the index.
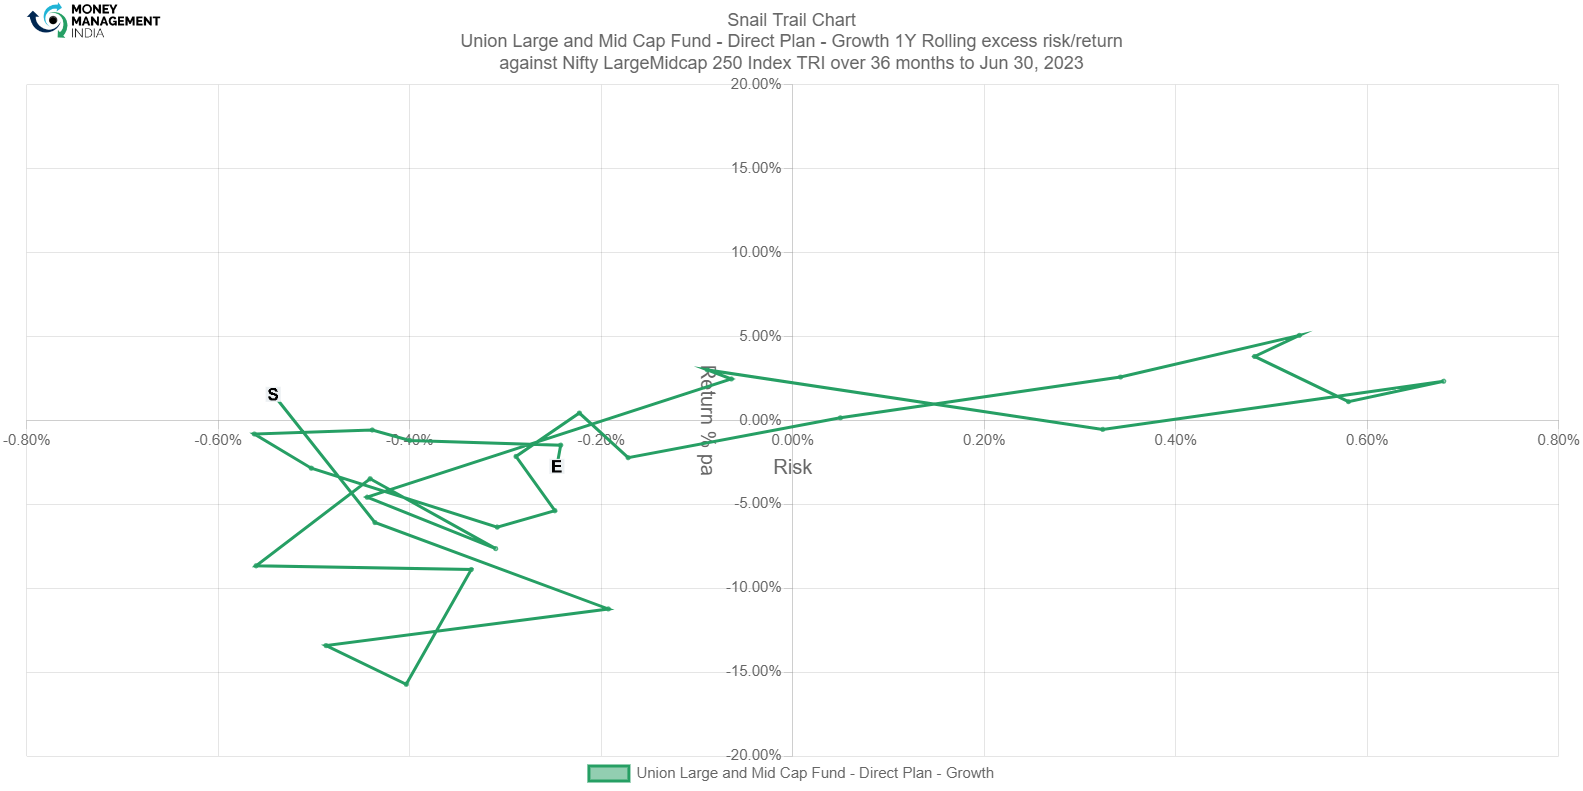
The snail trail chart shows that the fund had a negative risk of -0.543% in the beginning. The fund underperformed from Feb-Oct 2021 with a low-risk level ranging between -0.81% to -2.22%. It outperformed the index in May 2022 with the highest rolling return of 5.07% and risk of 0.529%.
Tracking Error
The tracking error chart shows how the fund ‘tracks’ against the index. The higher the TE, the more active the fund’s return has been, with the 2-4% range considered to be barely active, the 4-6% range considered to be reasonably active, and anything higher attributed to concentrated/focused funds. Funds with TE of less than 2% can be considered to be closet indexers.

The fund had high TE in the beginning, but it eventually dropped down to 3.5690% by Jan 2023. Since then, the fund’s TE rose to a level of 4.3050% and maintained its course till June 2023. The average TE is between 3.50% and 6%.
Information Ratio
Information ratio is a measure of risk-adjusted return as its excess return per excess unit of volatility. Active funds must have an IR higher than 1, higher than 1.3 is considered ideal.
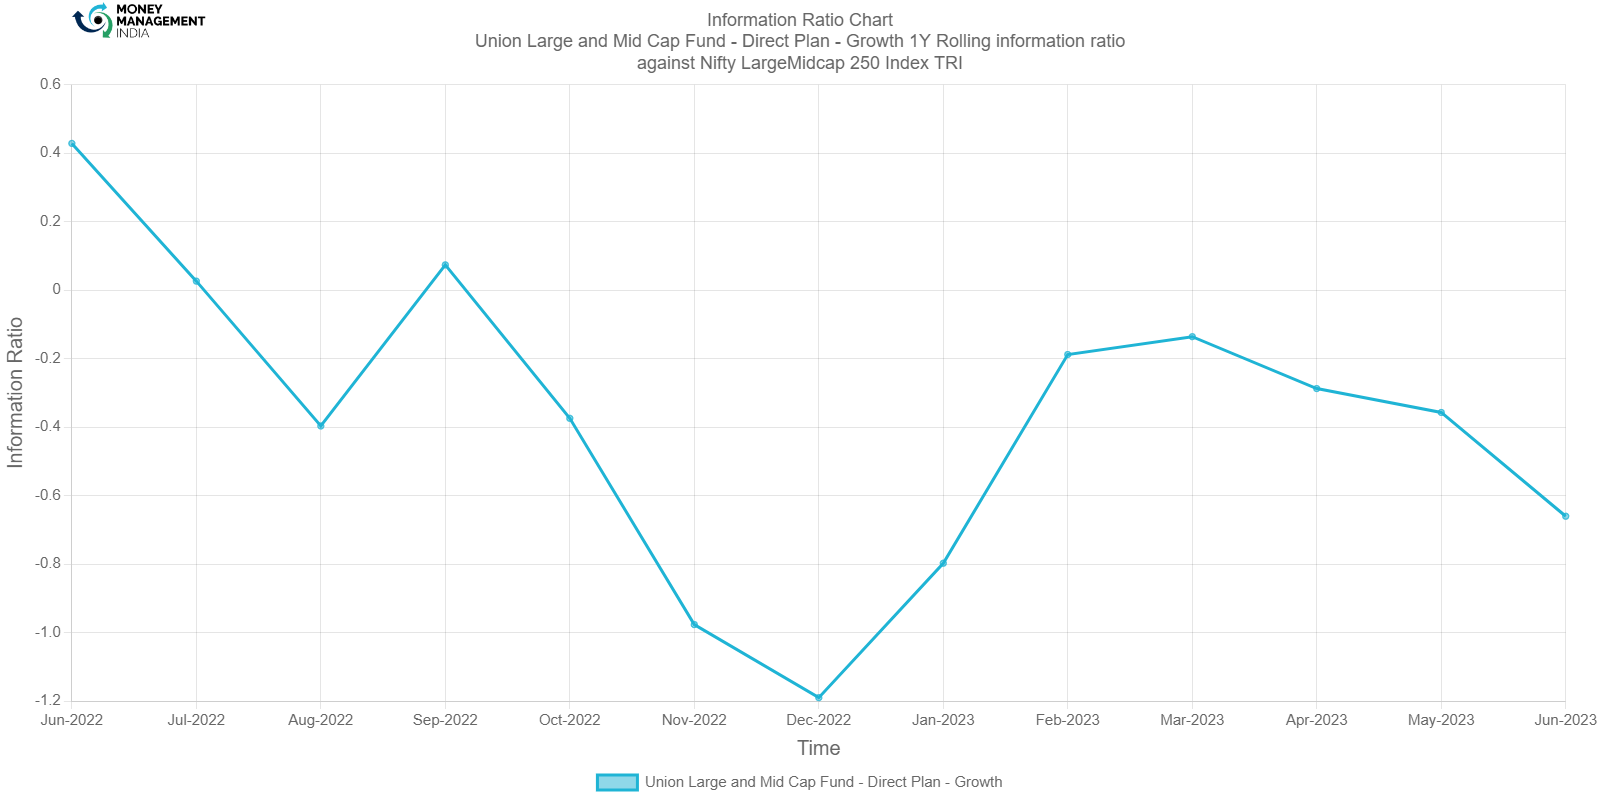
The IR steadily dropped and had some fluctuations in the middle. IR reached a peak of 0.0740 on Sep-2022. The fund dropped to -1.1900% in Dec-2022. This shows that the fund is passively managed.
Portfolio analysis
Stock style chart
Morningstar’s stock style chart shows the ‘style’ of the stocks in the portfolio in terms of size and value/growth style. The centroid shows the weighted average while the zone circle shows how varied the stock styles are.

The centroid of this fund shows that; the stocks in the portfolio are large cap-growth stocks; the ownership zone is diversified around large-cap growth and blend, whereas only growth assets are allocated from mid-cap.
Factor profile chart
Morningstar’s factor profile shows the historical style analysis of the stocks in the portfolio in terms of size, value/growth style, and other key factors. The blue circle shows the fund relative to the black dot for the category average.

The style factor shows that the fund is growth-oriented. Stocks have great momentum according to 5 years historical range. The fund has low yield, volatility, and liquidity. The fund’s assets are profitable and are slightly better than the category average. The fund’s capital size is mid-level.
Prepared by Sai Mahesh, August 2023
You must be logged in to post a comment.