ISIN INF903J01PR9
Overall Analysis
The 3-year rolling return shows the fund’s performance is deteriorating. Short-term outbursts of performance can be seen and the fund even crossed the benchmark in such areas, but the long-term performance as shown by rolling returns and IR is not good.
Performance Analysis
Rolling returns in quartiles
The rolling return chart shows excess 3-year annualized returns in the context of peer return quartiles. The blue line’s time above the third green median line indicates the fund’s better than the median performance of the benchmark.

The 3-year rolling returns show that the fund outperformed the benchmark from Dec 2017 till Apr 2021. The maximum return for the fund is at 4.98% on Sep 2019. The fund lost its momentum and fell below the median level at -2.28 % on June 2023
Rolling Risk/return (snail-trail)
The rolling risk/return chart shows excess 3-year annualized returns relative to the index. The top left quadrant would indicate higher returns with lower volatility than the index.
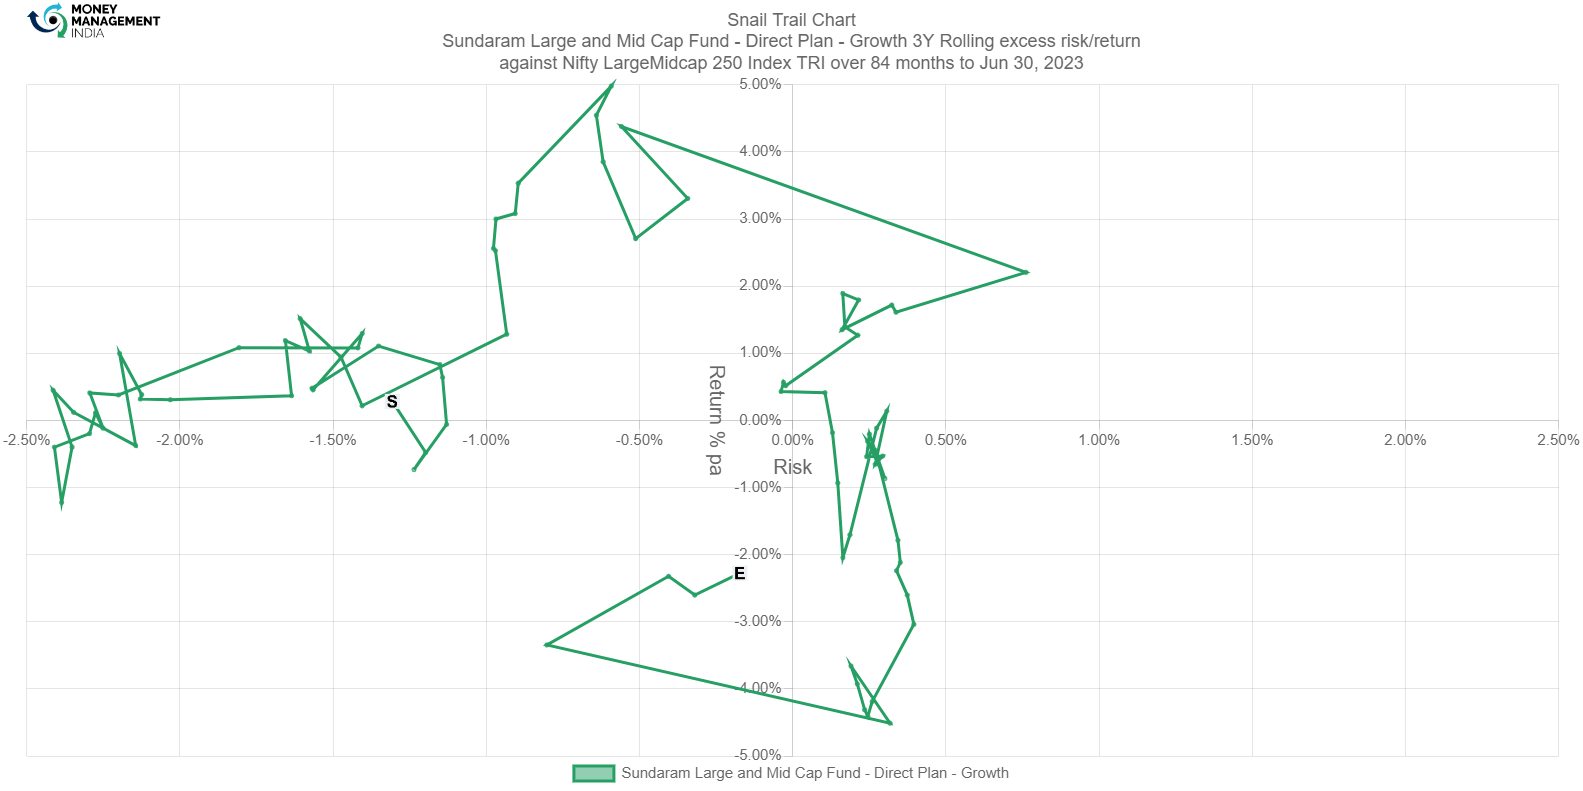
This graph shows that the fund outperformed the index from late 2017 till early 2021. They outperformed the index with low and high levels of risk ranging from -2.38% – 0.4% and returns ranging from -4.51% -4.98%. The fund has a return of -2.28% as of June 2023.
Tracking Error
The tracking error chart shows how the fund ‘tracks’ against the index. The higher the TE, the more active the fund’s return has been, with the 2-4% range considered to be barely active, the 4-6% range considered to be reasonably active, and anything higher attributed to concentrated/focused funds. Funds with TE of less than 2% can be considered to be closet indexers.
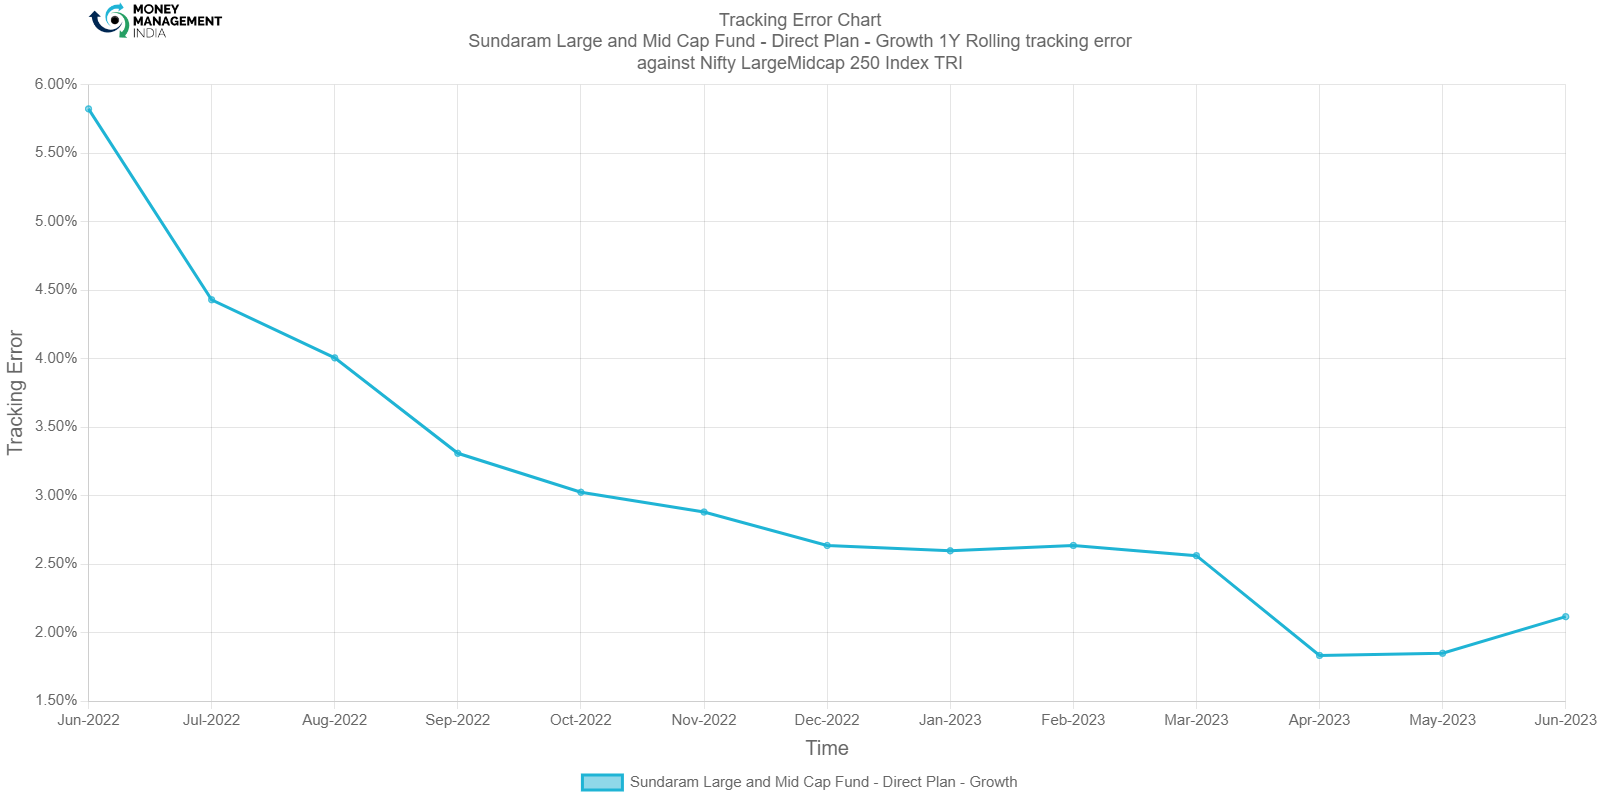
It can be seen that the TE is coming down to the barely active level of 2-4% by late 2022. By June 2023 the fund’s returns are at 2.1160%. The fund’s management is passive.
Information Ratio
The information ratio is a measure of risk-adjusted return as its excess return per excess unit of volatility. Active funds must have an IR higher than 1, higher than 1.3 is considered ideal.
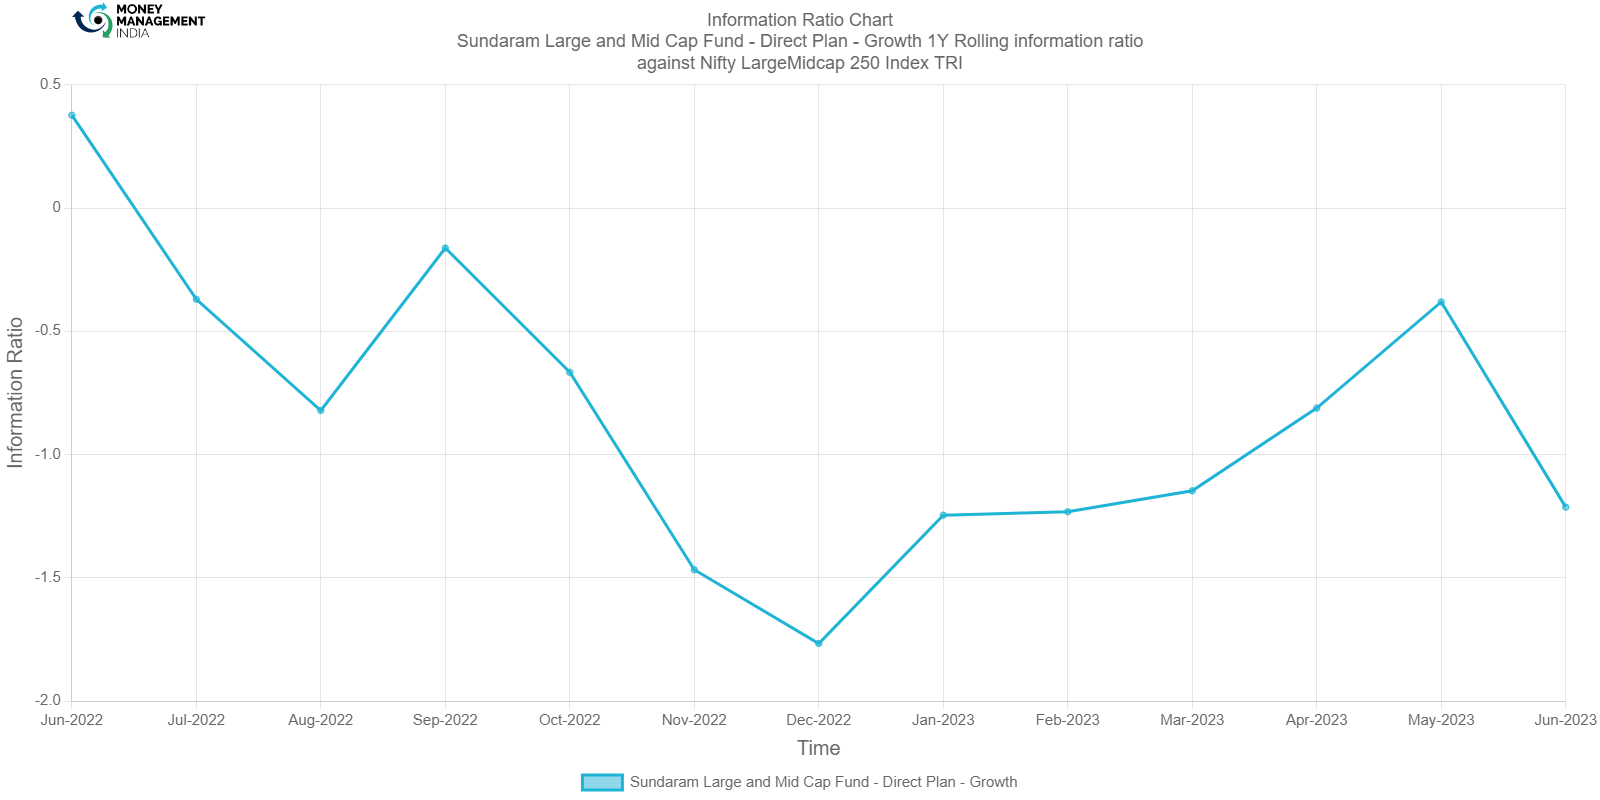
IR has struggled to achieve the minimum level during the initial stages but reached a peak of -0.1620 by Sep 2022. The fund lost its peak and went down to its lowest at -1.7670 by Dec 2022.. A peak can be seen in May—2023 at around -0.3810.
Portfolio analysis
Stock style chart
Morningstar’s stock style chart shows the ‘style’ of the stocks in the portfolio in terms of size and value/growth style. The centroid shows the weighted average while the zone circle shows how varied the stock styles are.

The centroid of the fund is closely related to the category average. Large-cap blended and growth stocks have the highest weightage in this fund. A few large-cap value stocks and some mid-cap and small-cap stocks together make up the rest of the fund’s assets.
Factor profile chart
Morningstar’s factor profile shows the historical style analysis of the stocks in the portfolio in terms of size, value/growth style and other key factors. The blue circle shows the fund relative to the black dot for the category average.
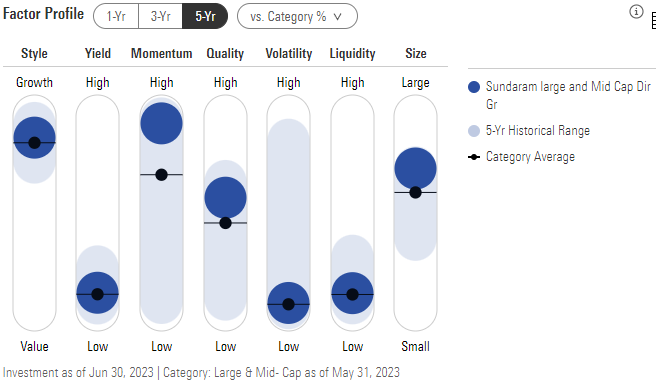
The growth-oriented fund has a low yield and high momentum indicating capital appreciation. The assets have been reasonably profitable shown by the higher quality, than the category average. Volatility and liquidity are at the category average, but the swing in volatility shows that the stocks have been highly volatile, this is due to the high allocation to blended stocks. The fund’s capital size is large.
Prepared by Sai Mahesh, August 2023
You must be logged in to post a comment.