ISIN INF917K01FT4
Overall Analysis
The 3-year rolling returns show the fund performed below the benchmark and other funds in the same investment universe. The snail chart shows that the fund underperformed in active management.
Performance Analysis
Rolling returns in quartiles
The rolling return chart shows excess 3-year annualized returns in the context of peer return quartiles. The blue line’s time above the third green median line indicates the fund’s better than the median performance of the benchmark.
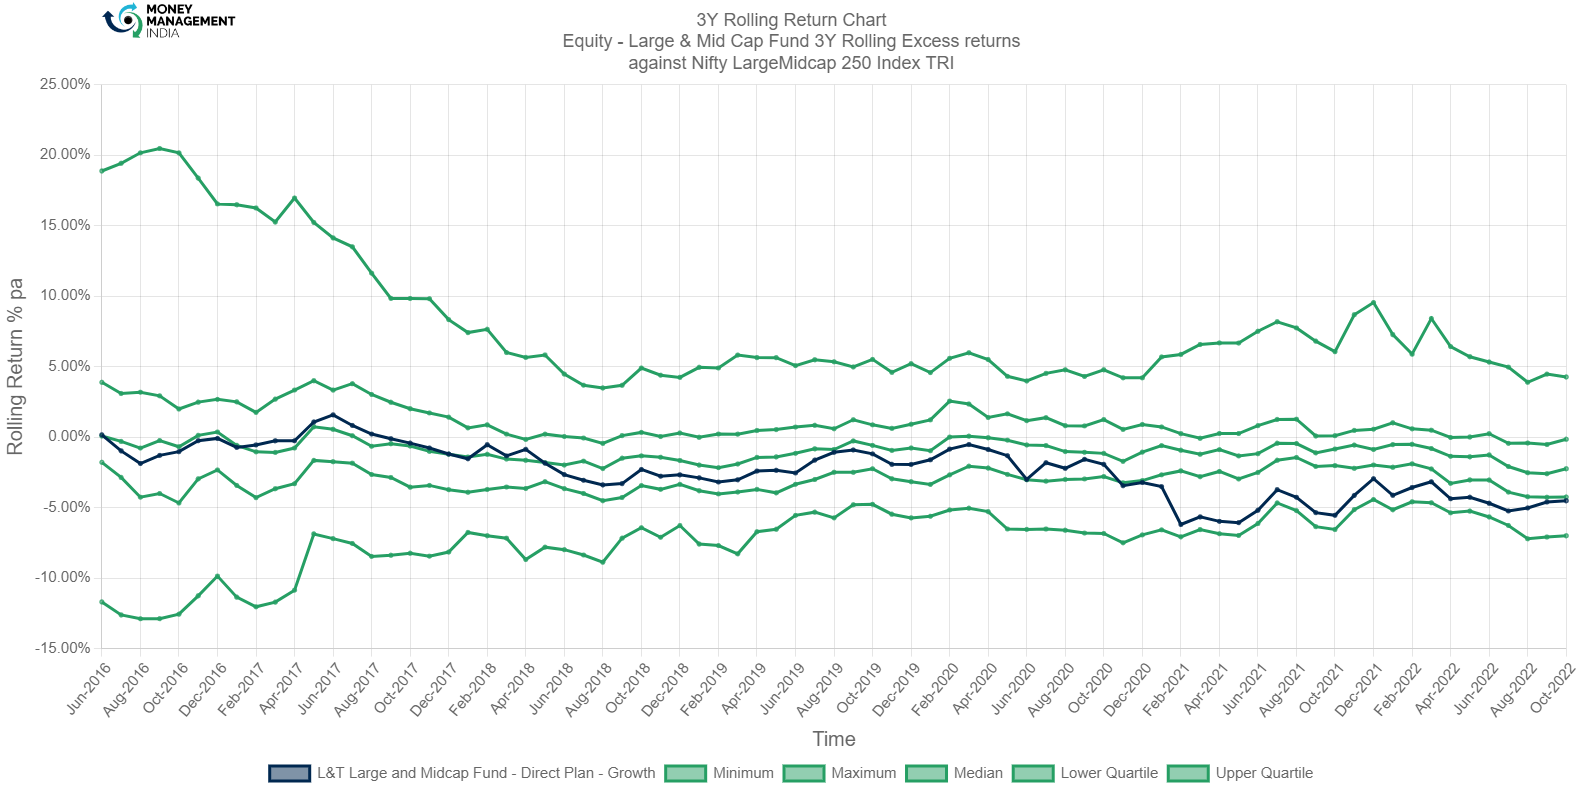
The fund performed better than the minimum required level but did not reach closer to the median. The fund maintained a performance level below the lower quartile.
Rolling Risk/return (snail-trail)
The rolling risk/return chart shows excess 3-year annualized returns relative to the index. The top left quadrant would indicate higher returns with lower volatility than the index.
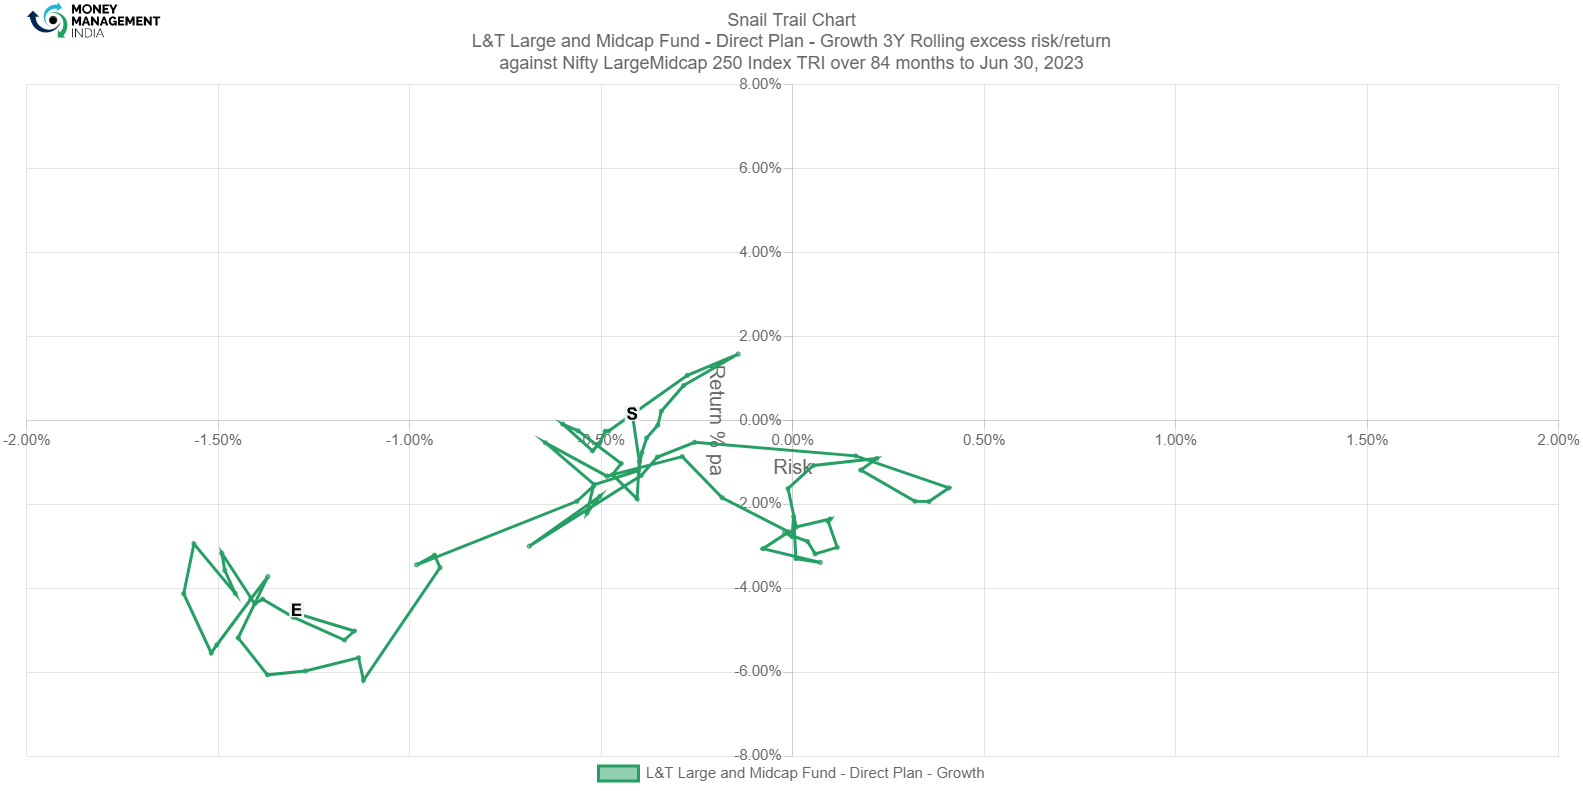
The snail trail analysis shows that the fund had a really good start, but failed to keep up the good run. It maintained course in the underperformance quartile for a long period.
Tracking Error
The tracking error chart shows how the fund ‘tracks’ against the index. The higher the TE, the more active the fund’s return has been, with the 2-4% range considered to be barely active, the 4-6% range considered to be reasonably active, and anything higher attributed to concentrated/focused funds. Funds with TE of less than 2% can be considered to be closet indexers.

The volatility in the TE explains the active management of the fund. The fund had a peak TE of 9.5700% during April 2021. Lately, the volatility decreased and the fund had a TE of 6.1650% by Oct-2022. The fund is highly active.
Information Ratio
The information ratio is a measure of risk-adjusted return as its excess return per excess unit of volatility. Active funds must have an IR higher than 1, higher than 1.3 is considered ideal.
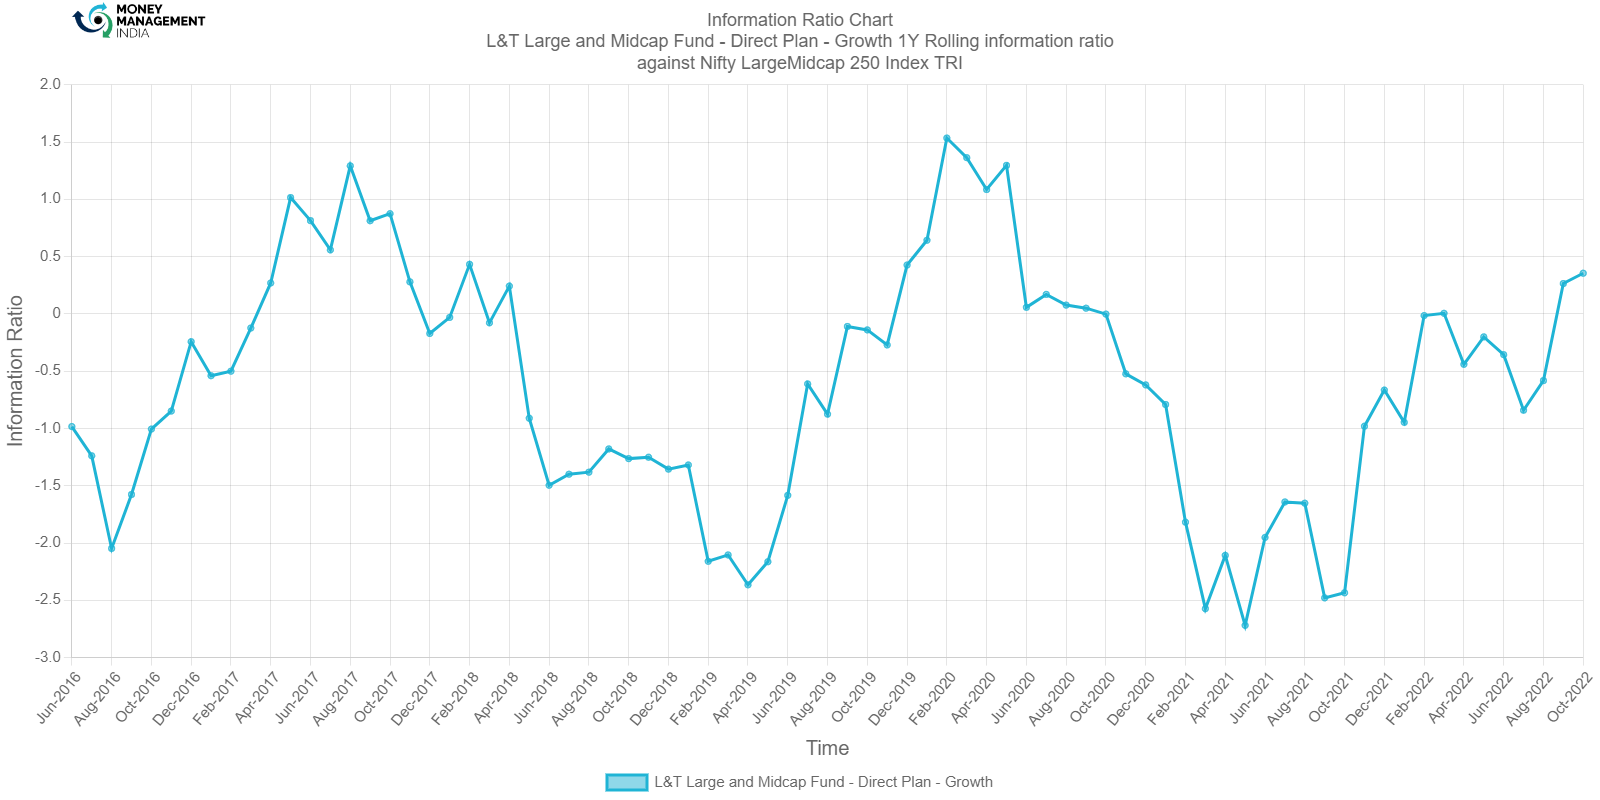
The IR significantly dropped by Jun-2021 and started to recover by Aug-2022. By Oct-2022, IR for the fund was 0.3550 which is below the average level. The active management failed to beat the benchmark returns.
Portfolio analysis
Stock style chart
no data
Factor profile chart
no data
You must be logged in to post a comment.