ISIN INF767K01NE9
Overall Analysis
The 3-year rolling returns show the long-term performance of the fund is comparatively better than the benchmark. The fund’s active management strategy has given out good returns with lower risk levels. However, the fund seems to be facing shortfalls in the short term.
Performance Analysis
Rolling returns in quartiles
The rolling return chart shows excess 3-year annualized returns in the context of peer return quartiles. The blue line’s time above the third green median line indicates the fund’s better than the median performance of the benchmark.
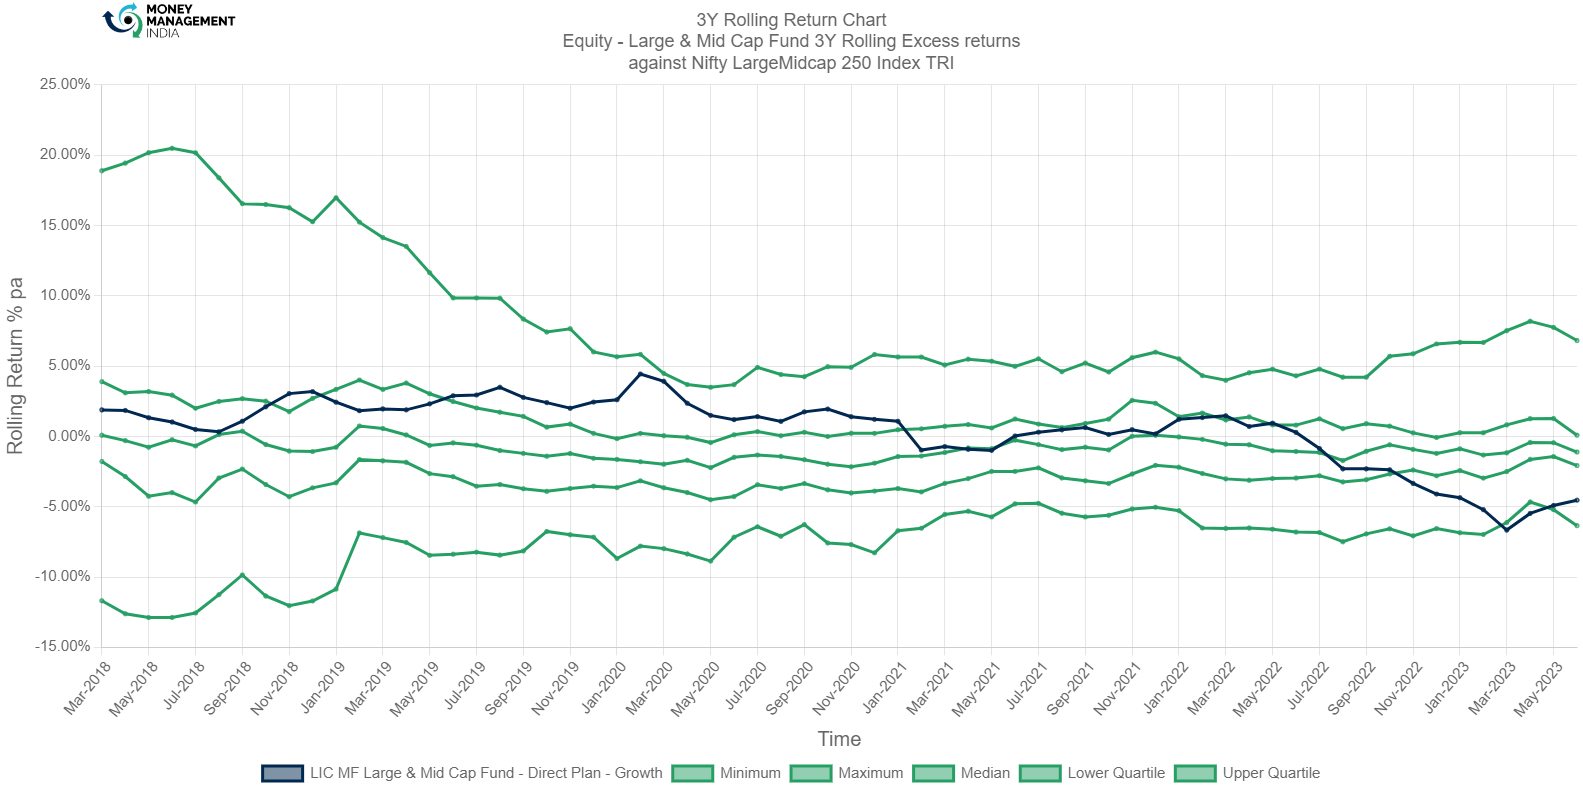
The 3-year rolling returns against the median look good in the long run. The fund performed better than the benchmark in the long run. The highest return they ever earned was in 2020 with 4.44%.
Rolling Risk/return (snail-trail)
The rolling risk/return chart shows excess 3-year annualized returns relative to the index. The top left quadrant would indicate higher returns with lower volatility than the index.
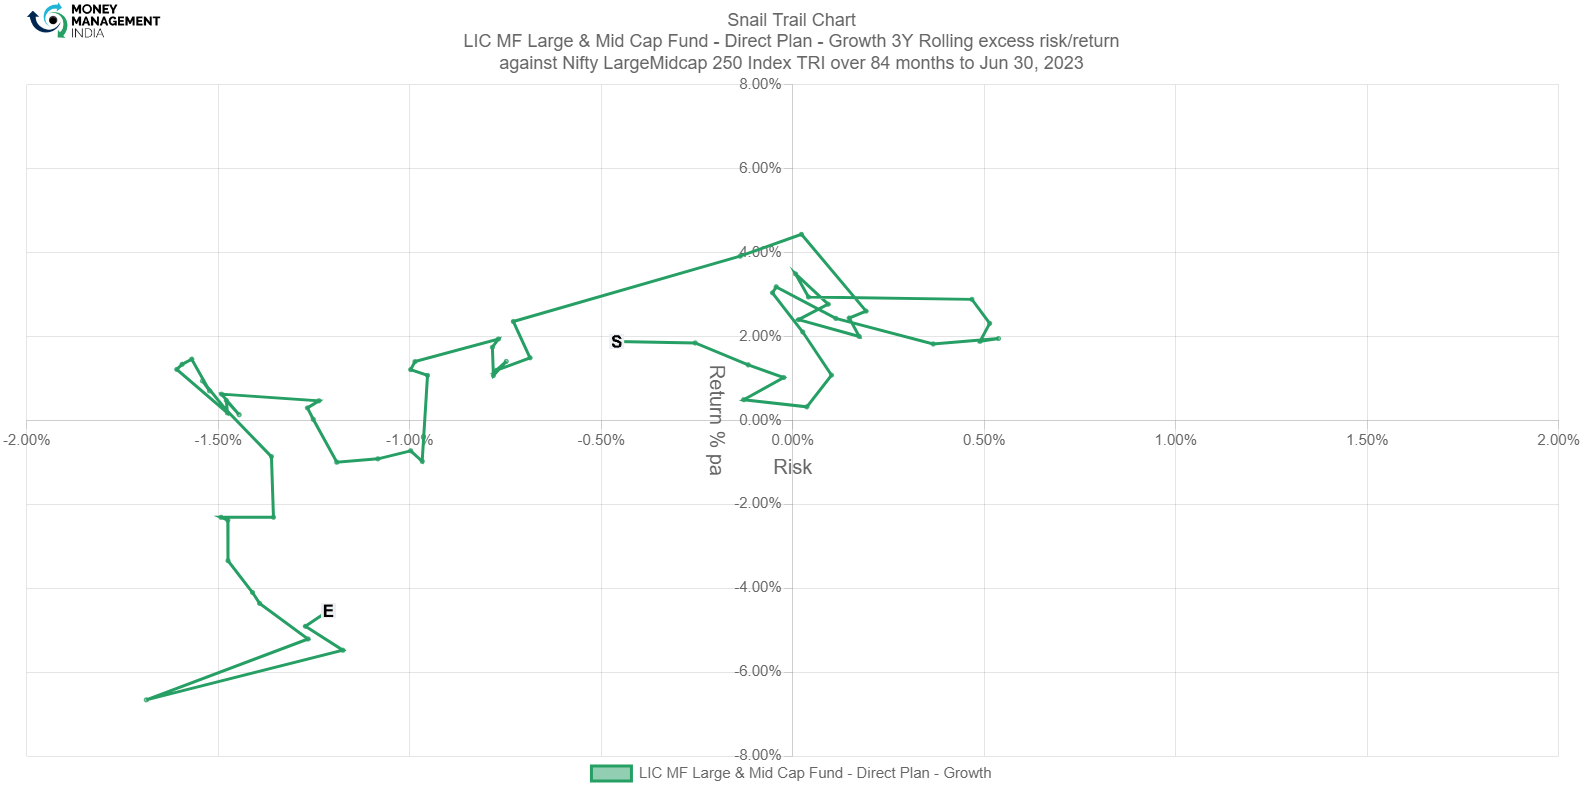
The fund outperformed with low risk till Apr-2022, where the fund earned a return of 0.70%. The fund outperformed its benchmark over the long run with returns up to 4.44%. Currently, the fund has a rolling return of -4.54% and -1.212% risk as of June 2023.
Tracking Error
The tracking error chart shows how the fund ‘tracks’ against the index. The higher the TE, the more active the fund’s return has been, with the 2-4% range considered to be barely active, 4-6% range considered to be reasonably active, and anything higher attributed to concentrated/focused funds. Funds with TE of less than 2% can be considered to be closet indexers.
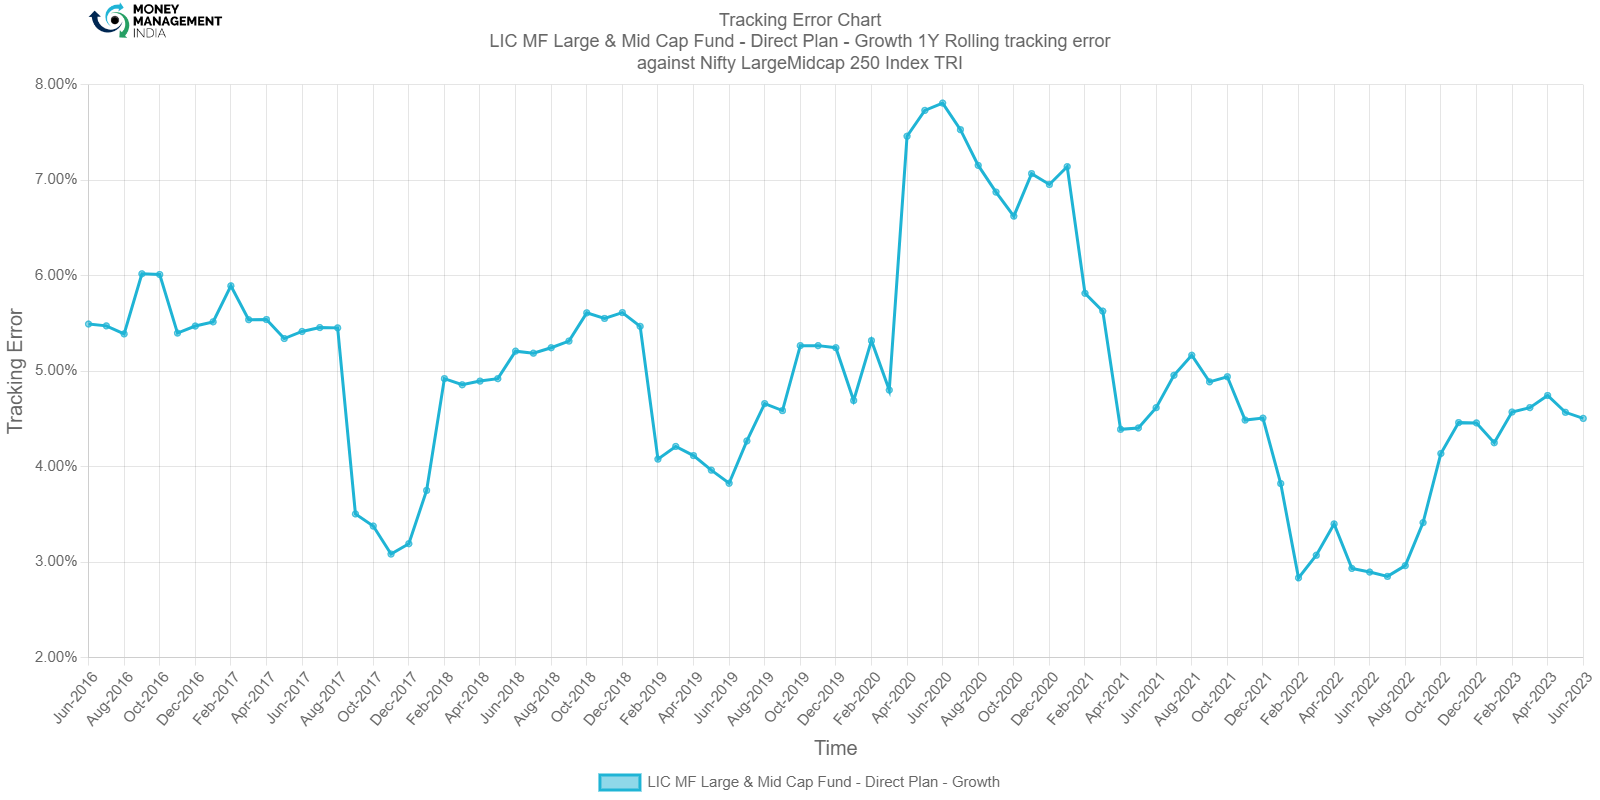
The volatility in the Tracking error is due to the high active management of the fund. The TE reached a high of 4.7450% by April 2023. The fund maintains a 4.505% TE as of June 2023, which means the fund is active. A 3-6% is maintained in the TE.
Information Ratio
The information ratio is a measure of risk-adjusted return as its excess return per excess unit of volatility. Active funds must have an IR higher than 1, higher than 1.3 is considered ideal.

TE volatility has caused the volatility in the Information Ratio. The fund’s IR went to an all-time high of 2.3290 by Feb-2020, followed by an all-time low of -2.1350 on Jun-2023.
Portfolio analysis
Stock style chart
Morningstar’s stock style chart shows the ‘style’ of the stocks in the portfolio in terms of size and value/growth style. The centroid shows the weighted average while the zone circle shows how varied the stock styles are.

The fund closely tracks and actively tries to generate returns superior to the index. Large-cap growth and blended stocks make up most of the portfolio. Mid-cap growth stocks make up the second largest. While the fund has small-cap stocks, they are significantly low.
Factor profile chart
Morningstar’s factor profile shows the historical style analysis of the stocks in the portfolio in terms of size, value/growth style, and other key factors. The blue circle shows the fund relative to the black dot for the category average.

The style factor shows the fund is growth-oriented. Low yield and high momentum indicate that the stocks have significantly appreciated in value than the category average. The fund has low volatility and low liquidity. The fund has a Mid-capital size.
Prepared by Sai Mahesh, August 2023
You must be logged in to post a comment.