ISIN INF277K01MK8
Overall Analysis
The 3-year rolling returns look good. High TE shows that the fund actively tried to generate returns better than the benchmark. IR shows that the fund generates better risk-adjusted returns as compared to the benchmark.
Performance Analysis
Rolling returns in quartiles
The rolling return chart shows excess 3-year annualized returns in the context of peer return quartiles. The blue line’s time above the third green median line indicates the fund’s better than the median performance of the benchmark.
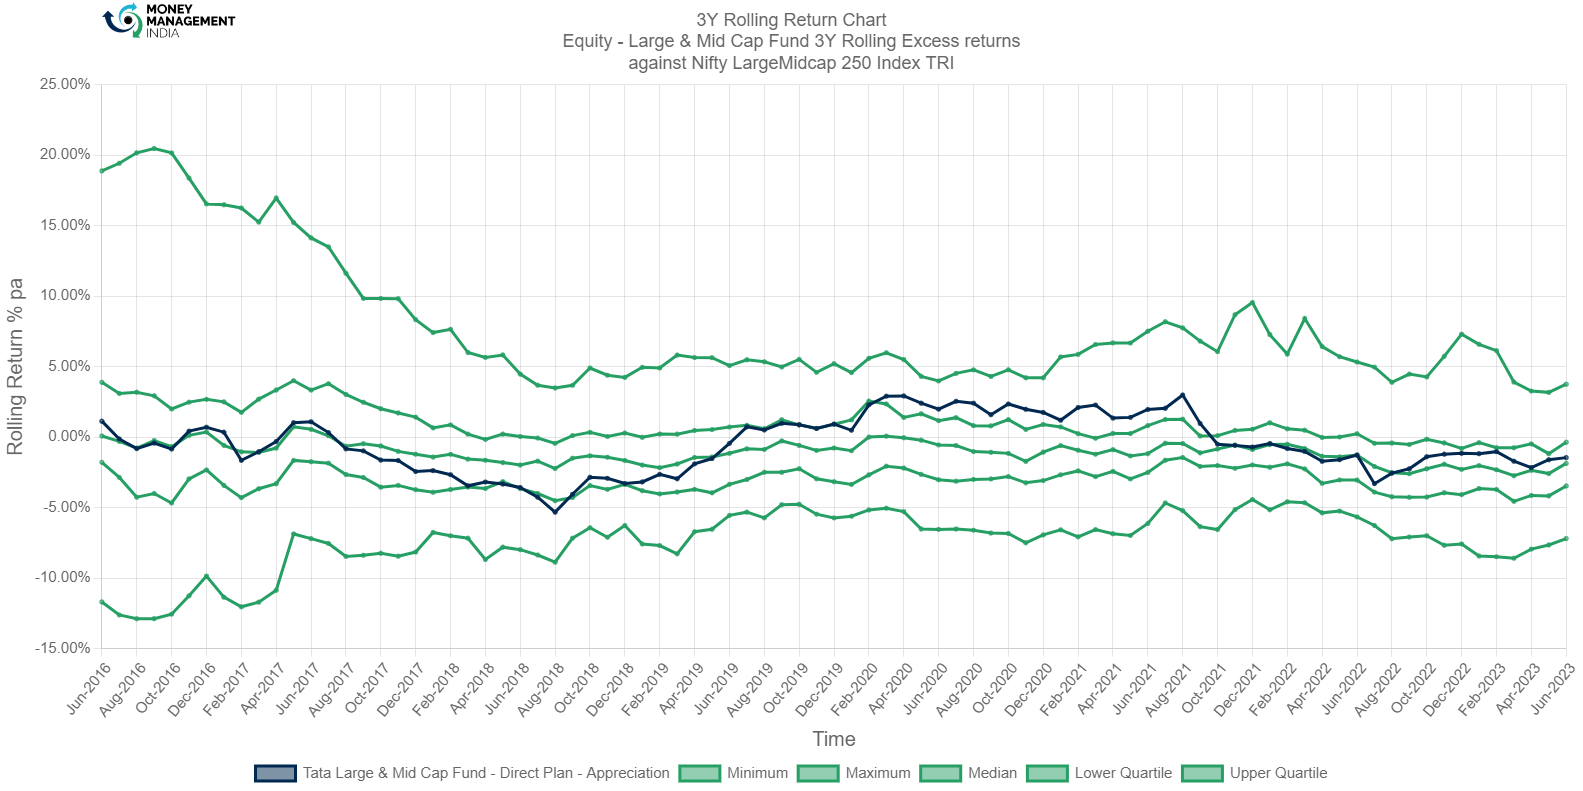
The 3-year rolling returns show that the fund traveled closely to the median. It outperformed the benchmark between Feb-2020 and Aug-2021 with returns between 2.30%- and 2.99%. The fund’s return as of June 2023 is at -1.45%.
Rolling Risk/return (snail-trail)
The rolling risk/return chart shows excess 3-year annualized returns relative to the index. The top left quadrant would indicate higher returns with lower volatility than the index.
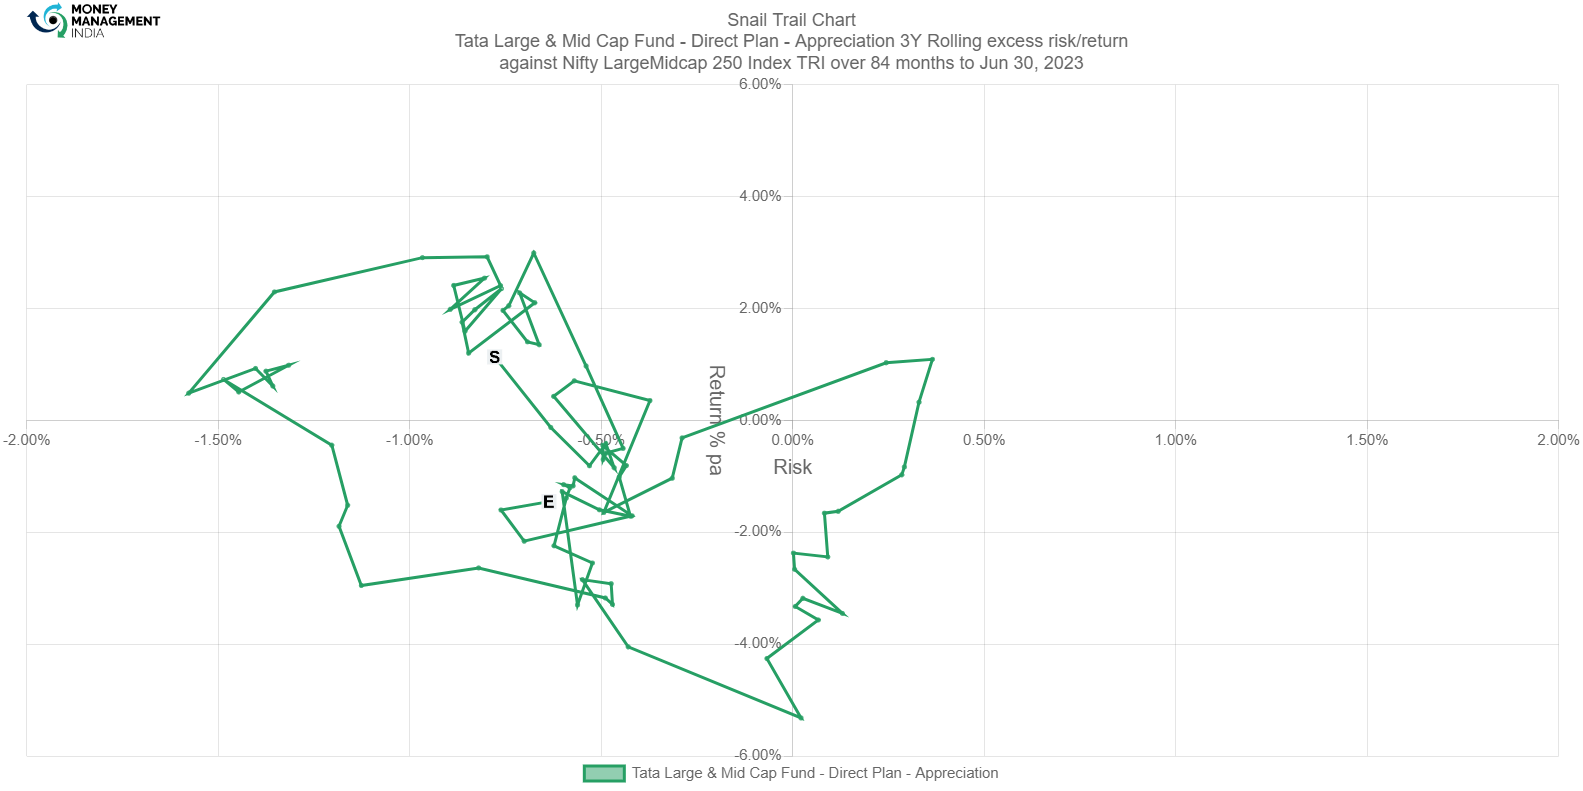
This fund started outperforming the index with low risk. The fund spent a significant time in the lower quartile with low risk resulting in returns ranging between -0.4% to 0.80%. This shows that the fund did not perform better than its stated benchmark.
Tracking Error
The tracking error chart shows how the fund ‘tracks’ against the index. The higher the TE, the more active the fund’s return has been, with the 2-4% range considered to be barely active, the 4-6% range considered to be reasonably active, and anything higher attributed to concentrated/focused funds. Funds with TE of less than 2% can be considered to be closet indexers.

The fund started low, but the management picked up pace and resulted in a higher TE of 5.7630% on Aug-2022. The chart shows that active management has constantly kept TE levels between 4-6%.
Information Ratio
The information ratio is a measure of risk-adjusted return as its excess return per excess unit of volatility. Active funds must have an IR higher than 1, higher than 1.3 is considered ideal.
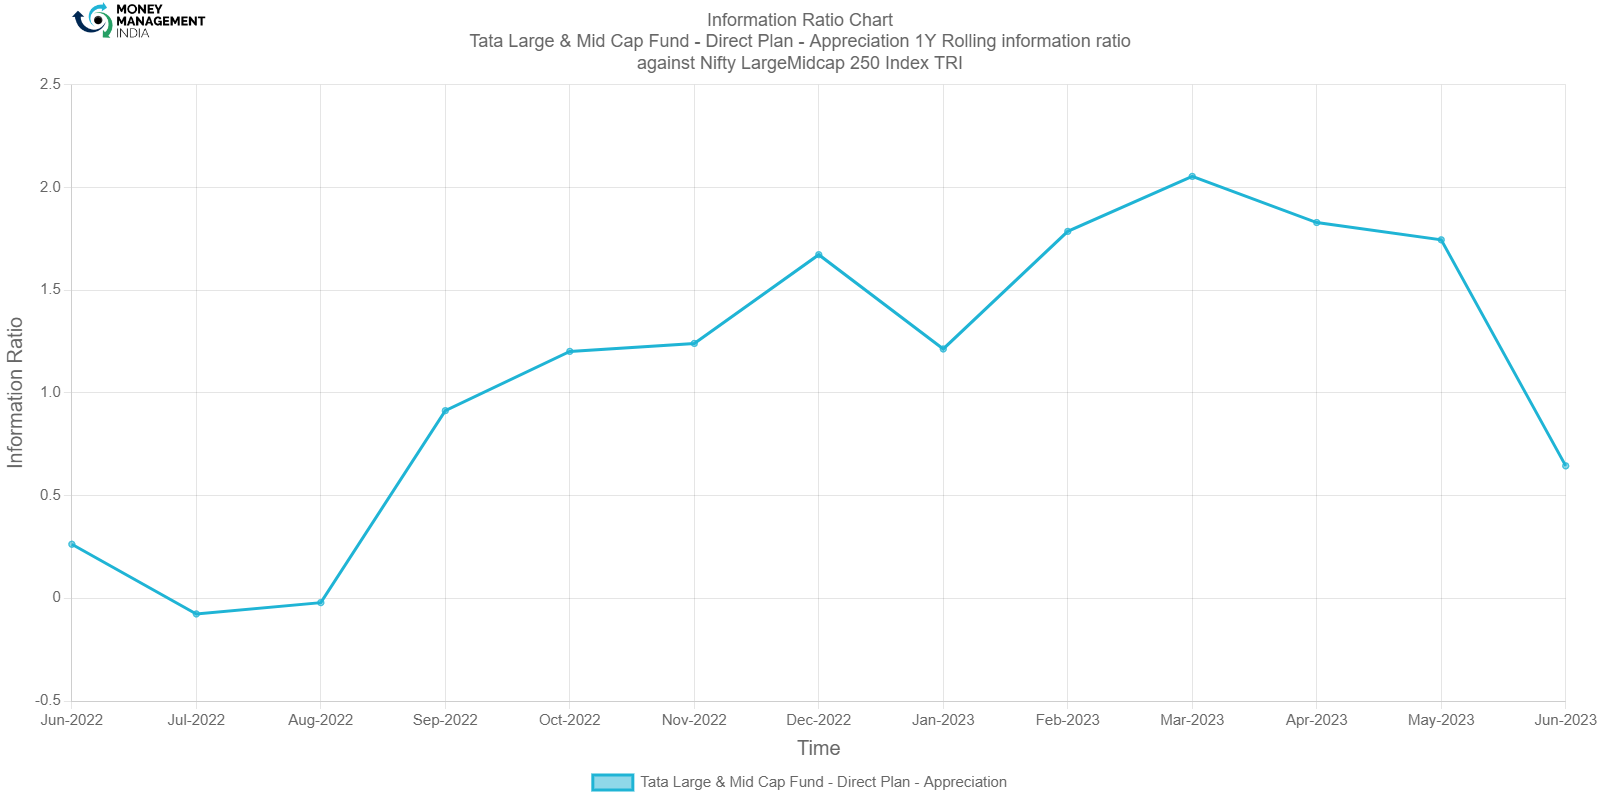
Due to the increase in TE, the IR for this fund was low till Sep 2022 with 0.9140. The fund achieved its peak IR of 2.0540 by March 2023. As of June 2023, IR holds at 0.6450 which is below the minimum required level for an active fund.
Portfolio analysis
Stock style chart
Morningstar’s stock style chart shows the ‘style’ of the stocks in the portfolio in terms of size and value/growth style. The centroid shows the weighted average while the zone circle shows how varied the stock styles are.
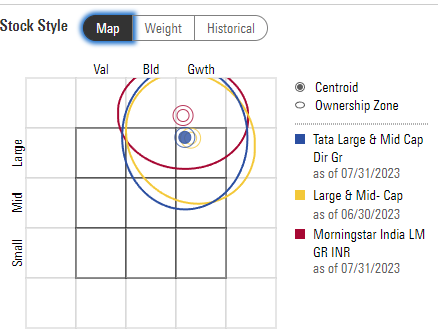
The centroid of the fund is closely related to that of the category average. Large-cap assets have the largest diversification and less weightage is given to mid-cap stocks. Fund has a few value stocks.
Factor profile chart
Morningstar’s factor profile shows the historical style analysis of the stocks in the portfolio in terms of size, value/growth style, and other key factors. The blue circle shows the fund relative to the black dot for the category average.

The growth-oriented fund had some value stocks, which can be seen in the historical range in style factor. The fund did give a low yield, but assets have grown significantly more than the category average. The profitability is lower than the category average but does have a reasonable historical range. The fund returns over the 12-month trailing period look a bit volatile. The fund has a large capital size.
Prepared by Sai Mahesh, August 2023
You must be logged in to post a comment.