ISIN INF194K01Z85
Overall analysis
The 3Y rolling return of the fund has been giving impressive returns against the benchmark with 17.58% in May 2023. A high TE and IR indicates that the fund is taking significant active risk in pursuit of generating excess returns, potentially through successful stock selection or other strategies.
Performance analysis
Rolling returns – 3yr rolling excess returns over 7 years
Snail trail – 3y rolling excess over 7yrs
Tracking error – 1yr rolling over 7yrs
Information ratio – 1yr rolling over 7yrs
Rolling returns in quartiles
The rolling return chart shows excess 3-year annualised returns in context of peer return quartiles. The blue line’s time above the third green median line indicates the fund’s better than median performance.
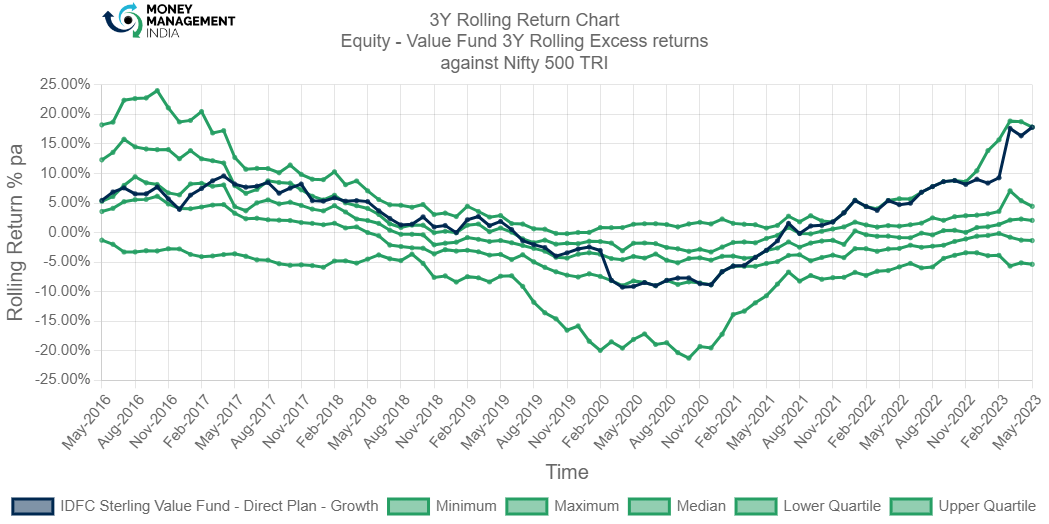
The 3Y rolling return chart of the fund shows that the fund had a rocky start although later it did outperform the benchmark giving 9.58% returns which was the highest between the year 2017 to 2019. From mid 2019 to mid 2021 the fund was underperforming and generated negative returns with the lowest -9.58% in Apr 2020. The fund has been actively outperforming the benchmark thus giving positive returns. It generated a positive alpha of 17.83% in May 2023.
Rolling risk/return (Snail-trail)
The rolling risk/return chart shows excess 3-year annualised returns relative to the index. The top left quadrant would indicate higher returns with lower volatility than index.
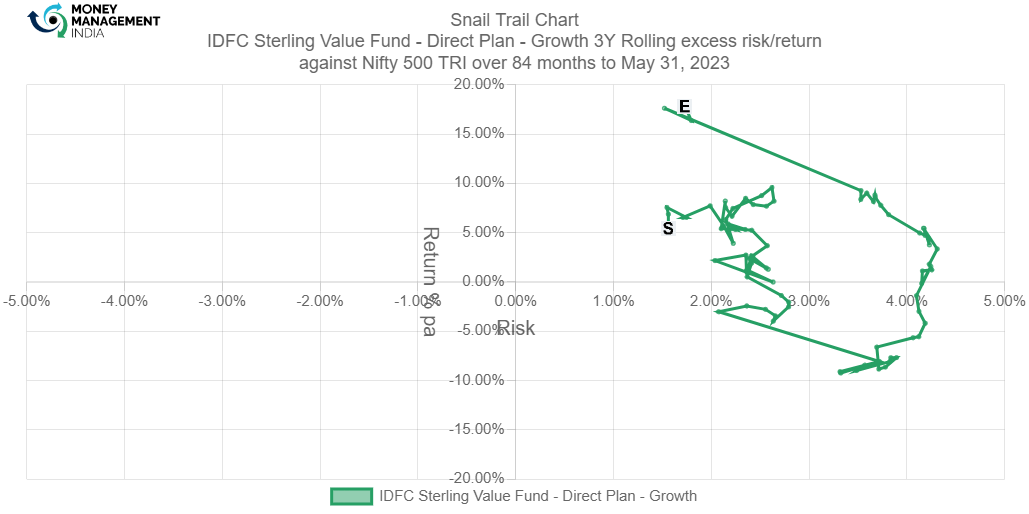
This fund has shown impressive 3-year excess returns, touching 17.62% per annum and a significant time around the 5-15% pa, whilst lower than index volatility of -1% to -10% pa between Jul 2019 to Aug 2021. However, the excess return went up to around 17.62% towards the end of 2023.
Tracking error
The tracking error chart shows how the fund ‘tracks’ against the index. The higher the TE, the more active the fund’s return has been, with the 2-4% range considered to be barely active, 4-6% range considered to be reasonably active and anything higher attributed to concentrated/focused funds. Funds with TE of less than 2% can be considered to be closet indexers.
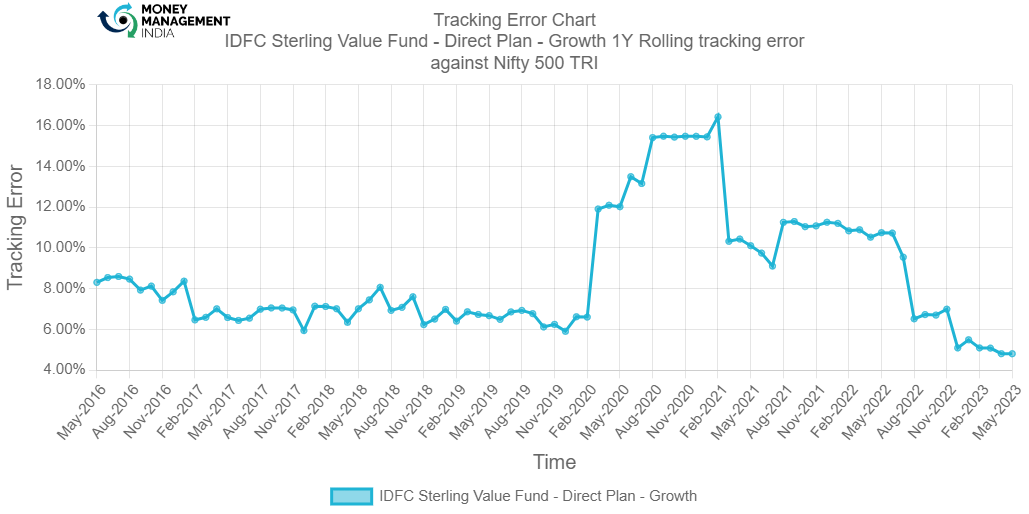
TE of the fund was around 8-5% from the start.On Feb 2021 the TE of the fund went up to 16.4% in Feb 2021. Active management has given a high TE in recent times.
Information ratio
The information ratio is a measure of ‘risk-adjusted return’ as it’s the excess return per unit of excess volatility. Active funds should have IR of higher than 1, ideally higher than 1.3 at least to indicate skill.
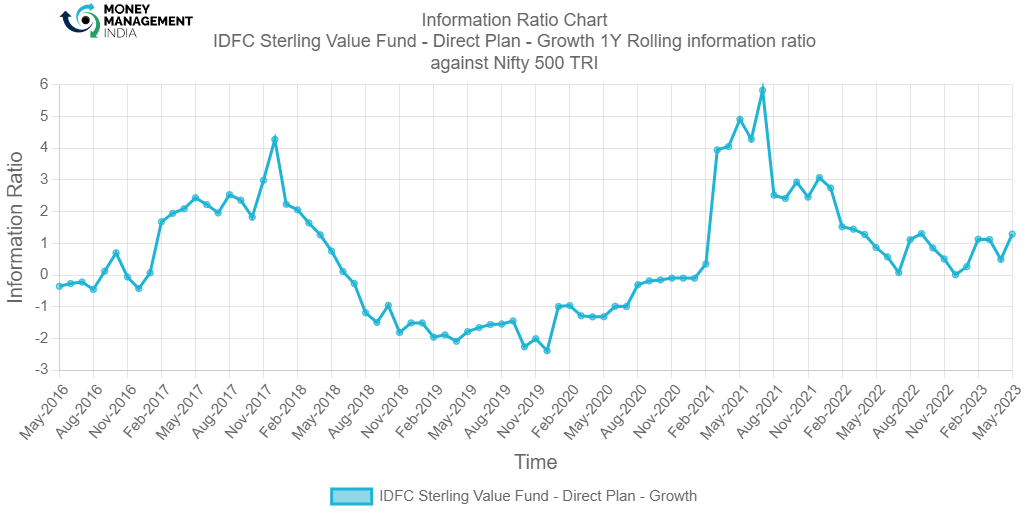
The Information ratio of the fund has been higher than 1 from the start. Although it went down to -2% in Dec 2019 which indicates that the fund deviated from its benchmark. Later it went up to 5.8% in July 2021 and gradually went down to 1% by the end of 2023.
Portfolio analysis
Stock style chart
Morningstar’s stock style chart shows the ‘style’ of the stocks in the portfolio in terms of size and value/growth style. The centroid shows the weighted average while the zone circle shows how varied the stock styles are.

The stock style of the fund shows that the fund’s weighted average is somewhat different from the category average. The ownership zone of the fund shows that the blend and growth has made the largest asset classification, while allocating some value stocks. It ranges from large cap to mid cap.
Factor profile chart
Morningstar’s factor profile shows the historical style analysis of the stocks in the portfolio in terms of size, value/growth style and other key factors. The blue circle shows the fund relative to the black dot for the category average.

The style of the fund is higher growth-oriented as the exposure is more than value exposure, above the category average. It had some value stocks which can be seen in its historical range.It is generating a lower yield and is also quite below the average as we know a lower exposure to the yield factor indicates a lower yield for investors. The assets have grown significantly more than the category average. The profitability of the fund has outperformed the category average.The volatility and the liquidity is low.The market capitalization of the category average is quite higher than the fund, as the fund lies between the mid-small cap.
Prepared by – Ayushi Shervegar, August 2023
You must be logged in to post a comment.