ISIN INF966L01AN3
Overall analysis
Due to the short term of the fund, the returns seem great as compared to its peers. The TE and IR of the fund shows that the fund has been actively performed against in benchmark generating risk adjusted returns.
Performance analysis
Rolling returns in quartiles
The rolling return chart shows excess 1-year annualised returns in context of peer return quartiles. The blue line’s time above the third green median line indicates the fund’s better than median performance.
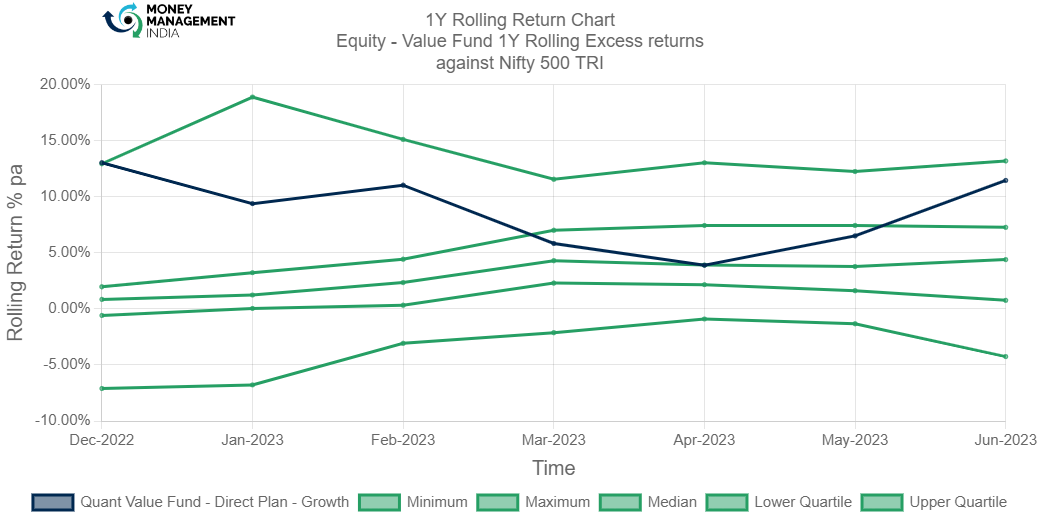
The fund rolling return chart shows that the fund has consistently been between the median and the maximum line from the start. The fund has been maintaining the average of 7% per annum. The excess return went upto 11.42% in Jun 2023 which indicates that the fund is performing better than the median performance.
Rolling risk/return (Snail-trail)
The rolling risk/return chart shows excess 1-year annualised returns relative to the index. The top left quadrant would indicate higher returns with lower volatility than index.
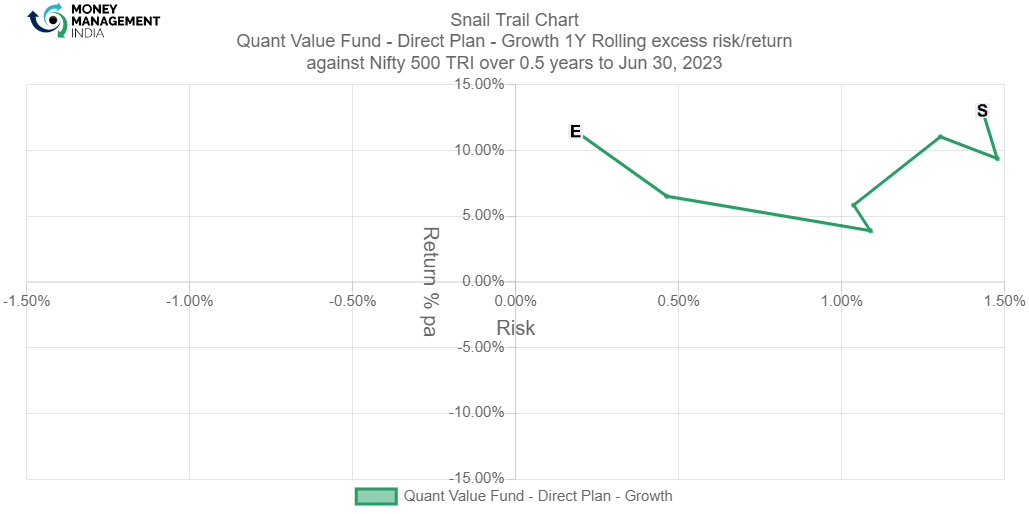
The snail trial chart of the fund rolling excess risk/return of 11.42% per annum high in Feb 2023. The fund was around 3-6% for a significant time and the inclined 4-5% in the end which indicates that the fund has been performing well.
Tracking error
The tracking error chart shows how the fund ‘tracks’ against the index. The higher the TE, the more active the fund’s return has been, with the 2-4% range considered to be barely active, 4-6% range considered to be reasonably active and anything higher attributed to concentrated/focused funds. Funds with TE of less than 2% can be considered to be closet indexers.

Information ratio
The information ratio is a measure of ‘risk-adjusted return’ as it’s the excess return per unit of excess volatility. Active funds should have IR of higher than 1, ideally higher than 1.3 at least to indicate skill.

The Information ratio of the fund was at 1.3% in the start, later it declined to less than 0. In Jun 2023 the IR of the fund was 1.6%, this indicates that the fund is performing actively.
Portfolio analysis
Stock style chart
Morningstar’s stock style chart shows the ‘style’ of the stocks in the portfolio in terms of size and value/growth style. The centroid shows the weighted average while the zone circle shows how varied the stock styles are.
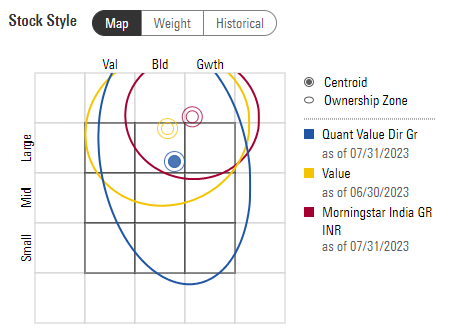
The stock style of the fund is different then its category average, the centroid can be seen in the large-blend section. The ownership zone shows that the investments are in the large, mid and small section of value, blend and growth section.
Factor profile chart
Morningstar’s factor profile shows the historical style analysis of the stocks in the portfolio in terms of size, value/growth style and other key factors. The blue circle shows the fund relative to the black dot for the category average.
chart
(comment on chart)
Prepared by – Ayushi Shervegar, August 2023
You must be logged in to post a comment.