ISIN INF760K01JW4
Overall analysis
1-yr rolling excess returns and TE against benchmark have been good overall. The fund had given the maximum excess return in comparison to its peers. IR of the fund is also quite active against its benchmark.
Performance analysis
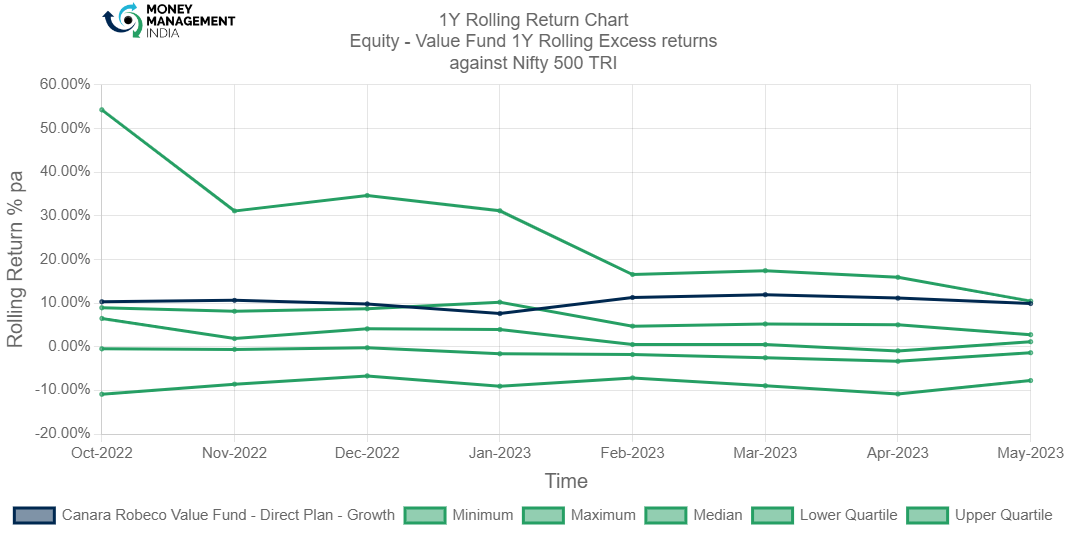
Rolling returns in quartiles
The rolling return chart shows excess 1-year annualised returns in context of peer return quartiles. The blue line’s time above the third green median line indicates the fund’s better than median performance.
.
The 1Y rolling return chart shows that the fund has an impressive performance as it has been outperforming the benchmark since the start generating positive return with 11.9% in Mar 2023.
Rolling risk/return (Snail-trail)
The rolling risk/return chart shows excess 1-year annualised returns relative to the index. The top left quadrant would indicate higher returns with lower volatility than index.
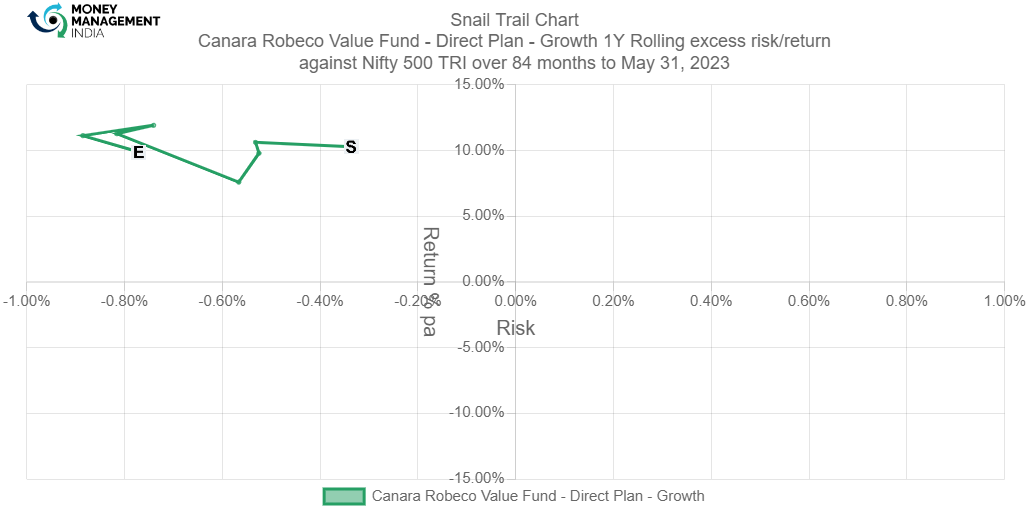
The snail trail chart of this fund shows that the fund has lower risk all the time to generate positive relative return since inception. This fund has shown 1-year rolling excess risk/return, touching 11.92% per annum at the risk level of -0.74%.
Tracking error
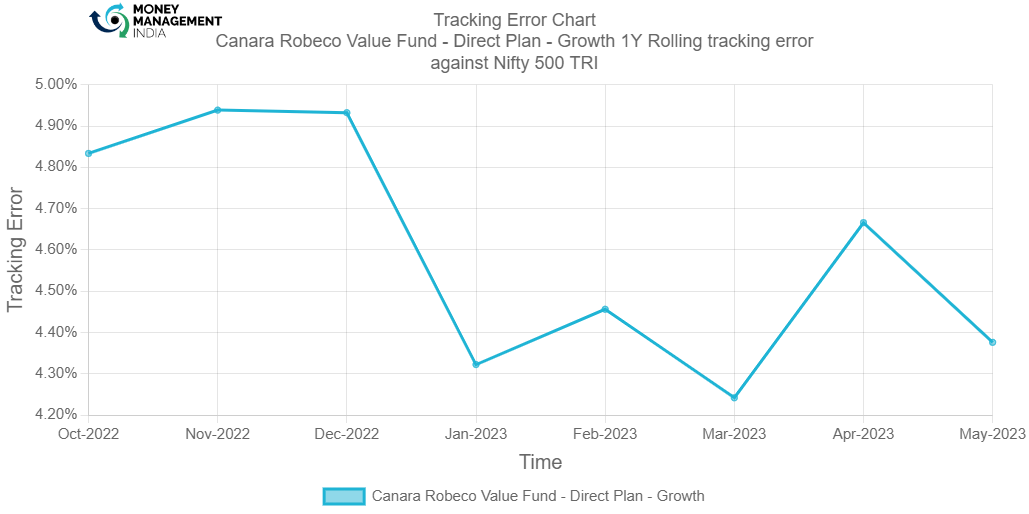
The tracking error chart shows how the fund ‘tracks’ against the index. The higher the TE, the more active the fund’s return has been, with the 2-4% range considered to be barely active, 4-6% range considered to be reasonably active and anything higher attributed to concentrated/focused funds. Funds with TE of less than 2% can be considered to be closet indexers.
\
Information ratio
The information ratio is a measure of ‘risk-adjusted return’ as it’s the excess return per unit of excess volatility. Active funds should have IR of higher than 1, ideally higher than 1.3 at least to indicate skill.
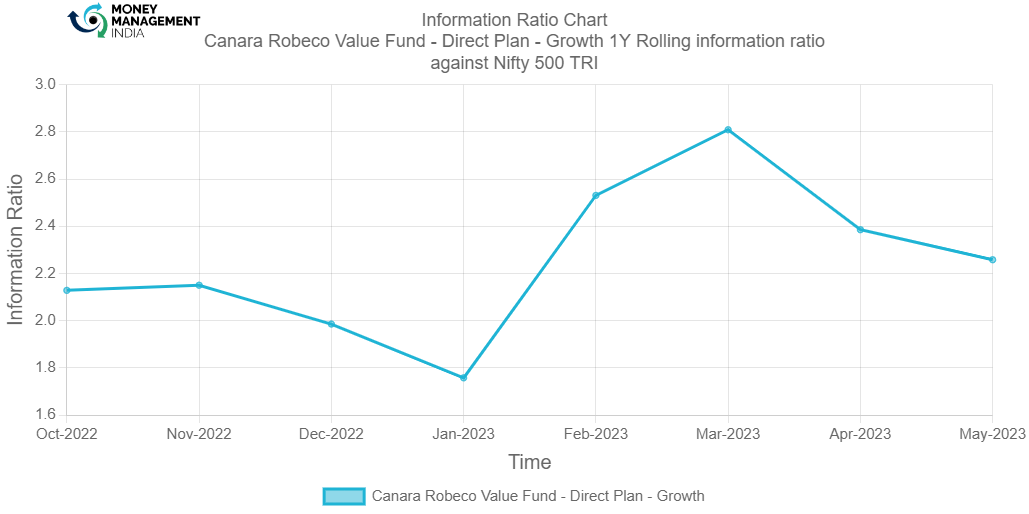
The Information ratio of the fund is above 2% throughout the year except, touching 1.9% in Dec 2022 and 1.7% in Jan 2023. It further inclined to 2.8% in Mar 2023, later declined to 2.2% by the end of May 2023. Overall it indicates the fund is performing well.
Portfolio analysis
Stock style chart
Morningstar’s stock style chart shows the ‘style’ of the stocks in the portfolio in terms of size and value/growth style. The centroid shows the weighted average while the zone circle shows how varied the stock styles are.

The stock style shows that the fund performance is slightly different than the category average. The centroid can be seen in the large cap of growth and blend section. The ownership zone has some mid cap stocks as well. Small cap stocks were out of consideration.
Factor profile chart
Morningstar’s factor profile shows the historical style analysis of the stocks in the portfolio in terms of size, value/growth style and other key factors. The blue circle shows the fund relative to the black dot for the category average.

The style of the fund is higher growth-oriented as the exposure is more than value exposure, above the category average. It is generating a lower yield and is also quite below the average as we know a lower exposure to the yield factor indicates a lower yield for investors.
The yield section is quite low also it’s below the category average.The assets have grown significantly more than the category average. The profitability of the fund is not up to the mark, the volatility and the liquidity of the fund is close to low exposure.The market capitalization is closer to large-cap and it is above the category average.
Prepared by – Ayushi Shervegar, August 2023
You must be logged in to post a comment.