ISIN INF090I01GY2
Overall analysis
The 3Y rolling returns have shown impressive returns as it generated alpha outperformed the benchmark. The TE of the fund shows that it is active. THe IR of the fund is ideal and risk adjusted returns can be seen.
Performance analysis
Rolling returns in quartiles
The rolling return chart shows excess 3-year annualised returns in context of peer return quartiles. The blue line’s time above the third green median line indicates the fund’s better than median performance.
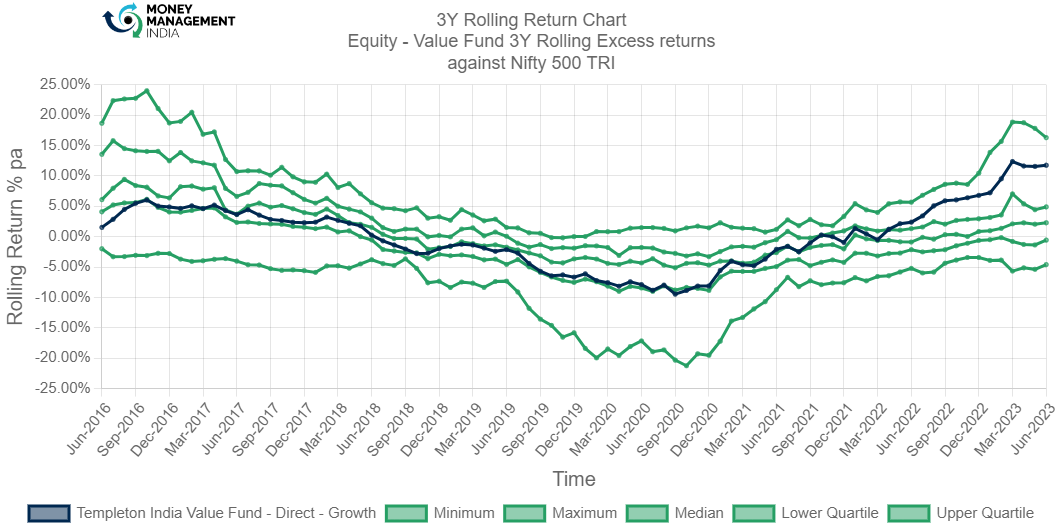
The 3Y rolling returns shows that the fund generated alpha returns in the start with high returns of 6.04% in Oct 2016, the fund started to deteriorate since mid 2018 and hence started the generated negative alpha till Apr 2022. Later it started to generate positive alpha and outperformed the benchmark. Giving high returns with 12.38% in Mar 2023.
Rolling risk/return (Snail-trail)
The rolling risk/return chart shows excess 3-year annualised returns relative to the index. The top left quadrant would indicate higher returns with lower volatility than index.
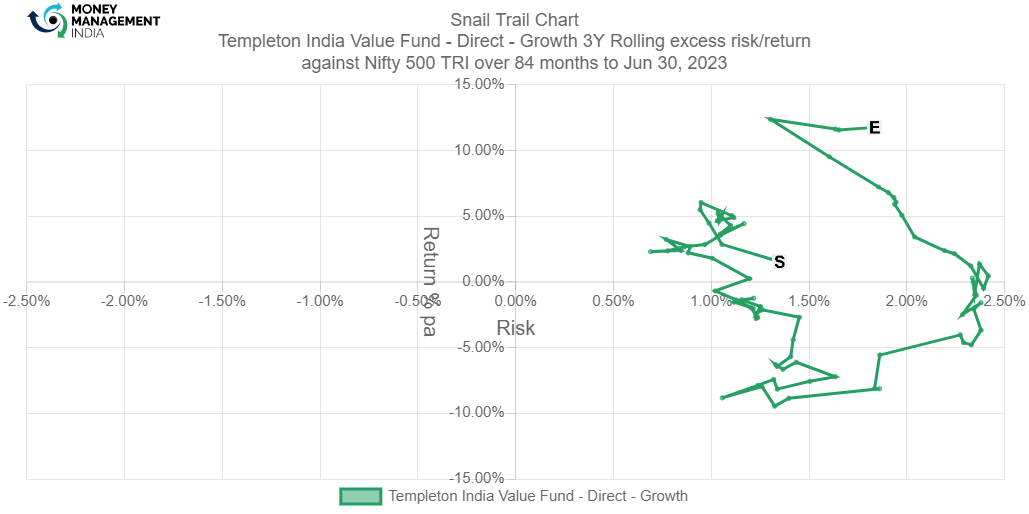
This fund has shown impressive 3-year excess returns,the snail trial chart shows that the start of the fund was little rocky and in between it gave negative returns.Although the fund took a turn in the year 2022 and has been giving high returns since then. Currently the rolling return is at 11.5%.
Tracking error
The tracking error chart shows how the fund ‘tracks’ against the index. The higher the TE, the more active the fund’s return has been, with the 2-4% range considered to be barely active, 4-6% range considered to be reasonably active and anything higher attributed to concentrated/focused funds. Funds with TE of less than 2% can be considered to be closet indexers.
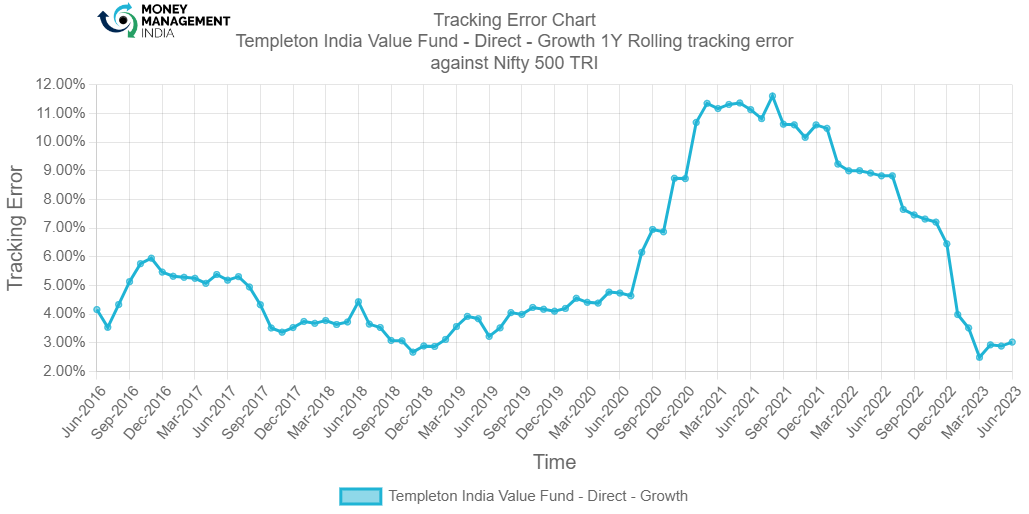
TE of the fund has been reasonably active from the start, since mid 2020 the TE of the fund inclined and touched 11% Feb 2023. Currently the fund is at 3%.
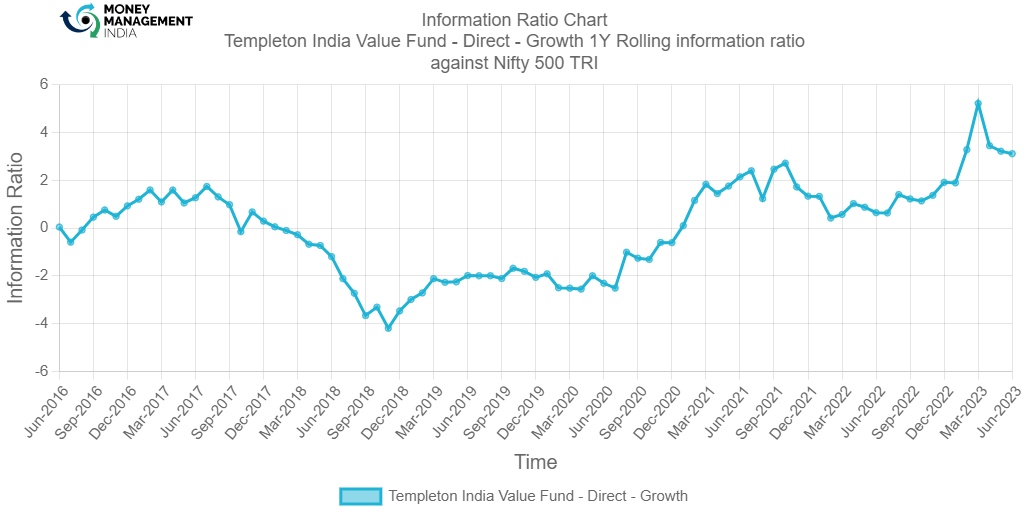
Information ratio
The information ratio is a measure of ‘risk-adjusted return’ as it’s the excess return per unit of excess volatility. Active funds should have IR of higher than 1, ideally higher than 1.3 at least to indicate skill.
Portfolio analysis
Stock style chart
Morningstar’s stock style chart shows the ‘style’ of the stocks in the portfolio in terms of size and value/growth style. The centroid shows the weighted average while the zone circle shows how varied the stock styles are.

The stock style of the fund shows that the centroid of the fund is in the large blend section. The ownership zone of the fund shows that major investments are in large cap stocks which are growth, value and blend oriented. Some investments can be seen in the mid cap stocks.
Factor profile chart
Morningstar’s factor profile shows the historical style analysis of the stocks in the portfolio in terms of size, value/growth style and other key factors. The blue circle shows the fund relative to the black dot for the category average.

The style of the fund is closer to the blend oriented, yield is quite low. The assets can be seen not growing over the period as it is quite low and below the category average. The profitability seems to be low for the fund. The volatility and liquidity of the fund is low. The market capitalization of the category average is closer to large-cap but the fund is below the category average.
Prepared by – Ayushi Shervegar, August 2023
You must be logged in to post a comment.