ISIN INF789F01UG3
Overall Analysis
The fund has large investments in blended stocks. 3-year rolling returns show that the fund struggled to outperform the index initially, but in recent years it did. Low TE indicates this is not an actively managed fund and the fund has a high IR of 5.
Performance Analysis
Rolling Returns in quartiles
The rolling return chart shows excess 3-year annualized returns in the context of peer return quartiles. The blue line’s time above the third green median line indicates the fund’s better than the median performance of the benchmark.
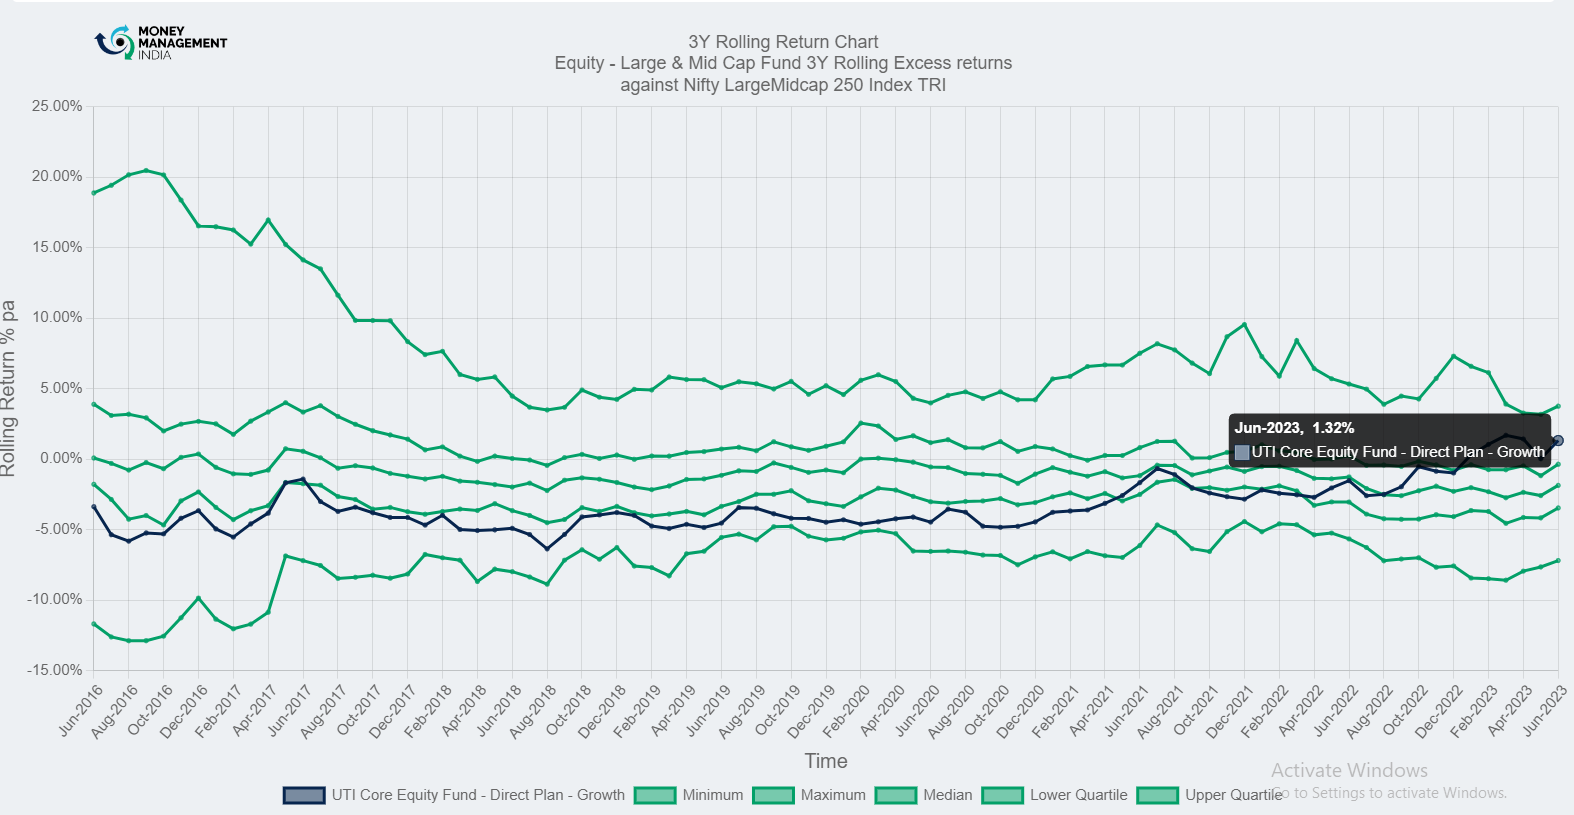
3-year rolling returns clearly indicate the fund’s performance was lower than the median. On Aug 2022, the fund had a rolling return of -2.50% and it crossed the median at that level. The fund performed better than the upper quartile on Jan-2023, with rolling returns of 0.30%. As of Jun-2023, the fund’s rolling returns hold at 1.32%.
Rolling Risk/return (snail-trail)
The rolling risk/return chart shows excess 3-year annualized returns relative to the index. The top left quadrant would indicate higher returns with lower volatility than the index.
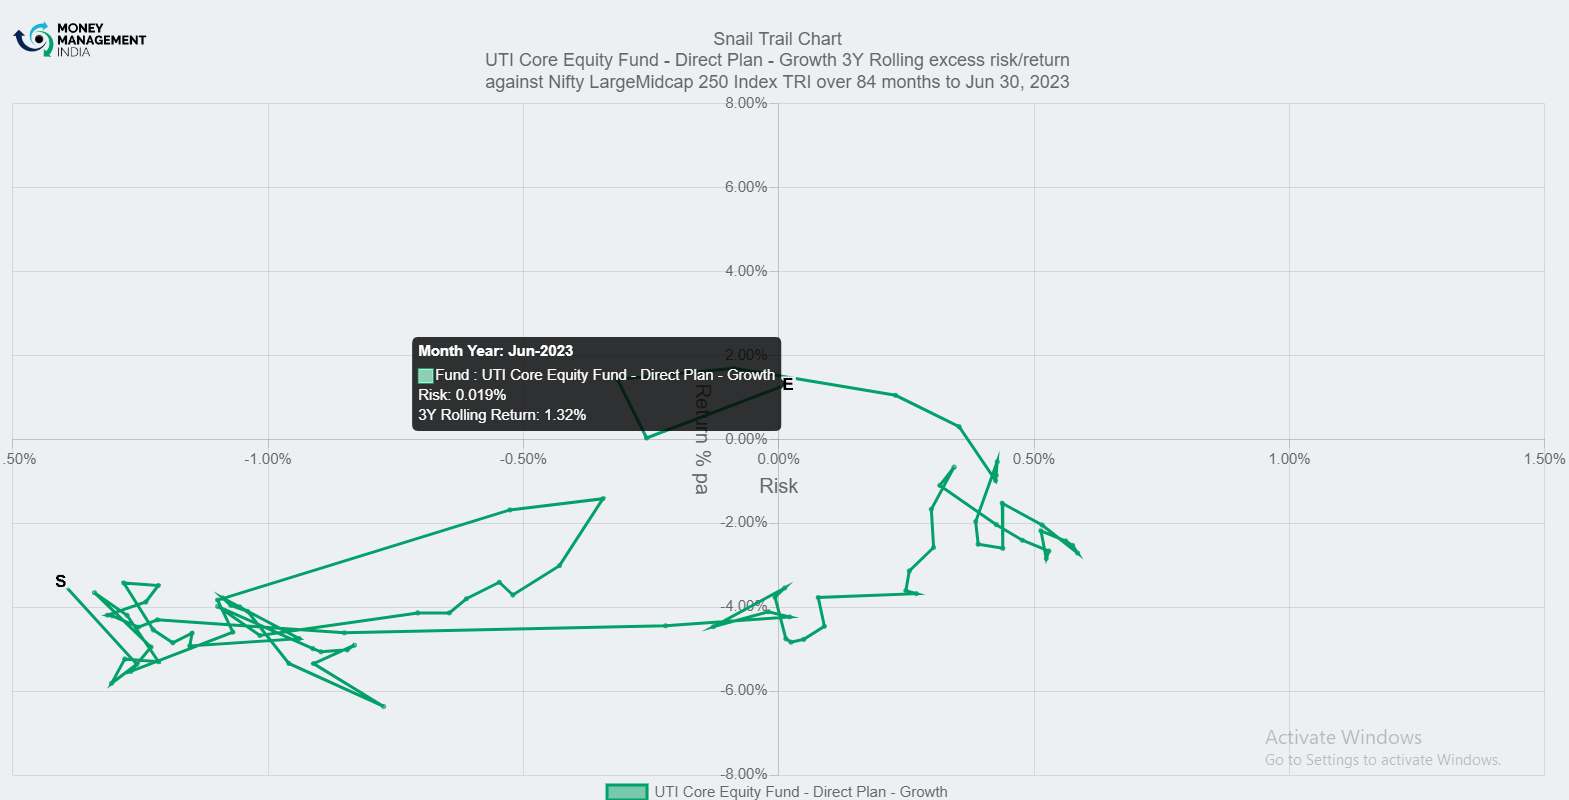
This extremely volatile fund underperformed than the index with an average risk level ranging between -0.35% to -1.46%. The fund underperformed with relatively high risk from Jul 2020- Dec 2020 with an average return ranging between -0.5% to -3.5% and risk ranging between 0.1% – 0.5%. Outperformance is seen starting from Jan-2023 with a return of 0.30% and a risk level of 0.35%. As of Jun-2023 fund’s return is 1.32% and the risk is 0.019%.
Tracking Error
The tracking error chart shows how the fund ‘tracks’ against the index. The higher the TE, the more active the fund’s return has been, with the 2-4% range considered to be barely active, the 4-6% range considered to be reasonably active, and anything higher attributed to concentrated/focused funds. Funds with TE of less than 2% can be considered to be closet indexers.
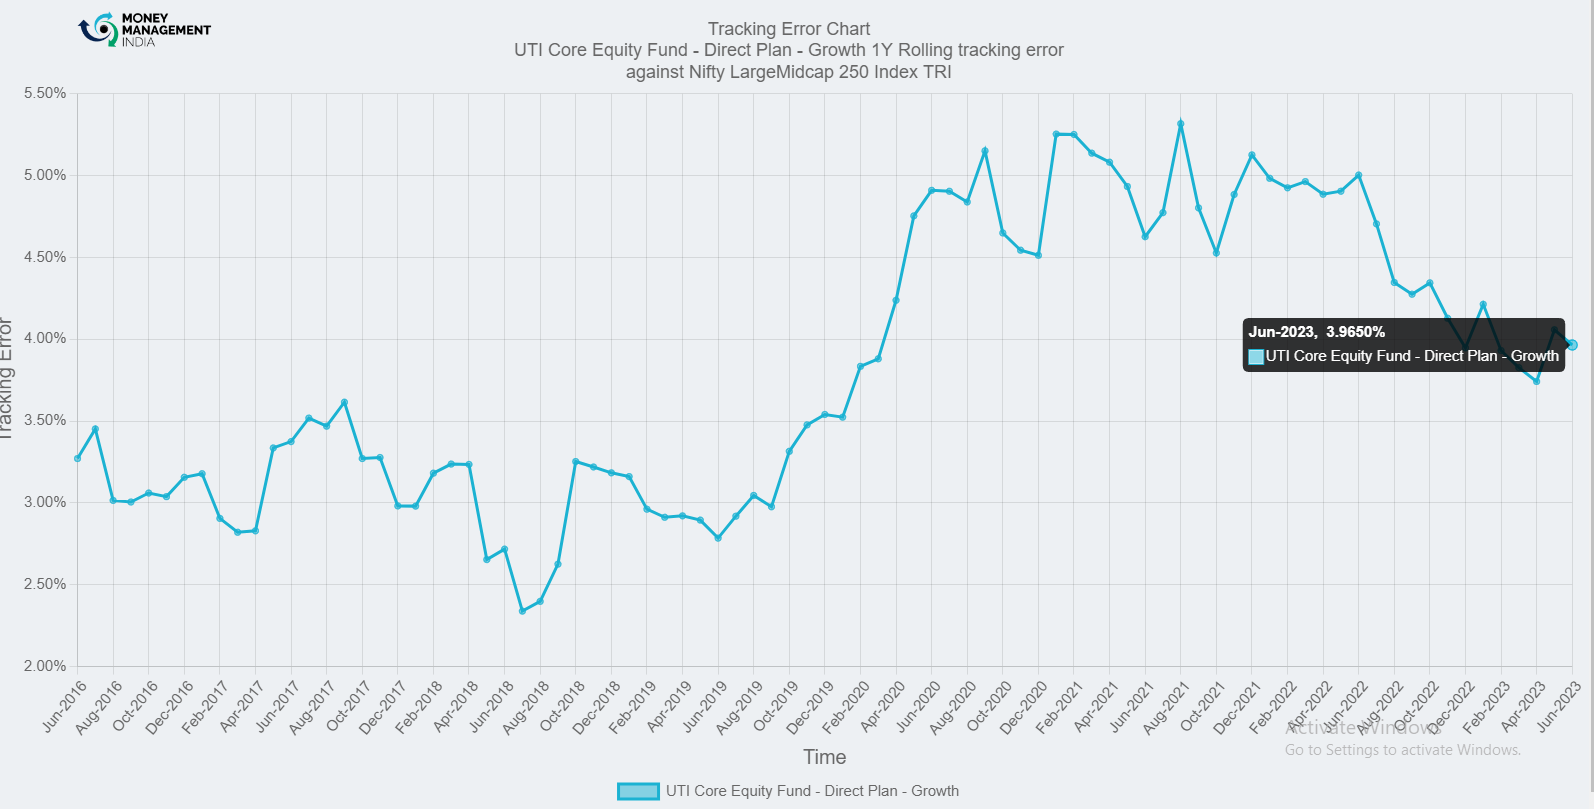
The overall TE is ranging between 2.5%- 5.3%. The fund maintained an increasing TE from Sep 2019-2020. As of June 2023, TE dropped down to 3.9650% indicating the fund is barely active.
Information Ratio
The information ratio is a measure of risk-adjusted return as its excess return per excess unit of volatility. Active funds must have an IR higher than 1, higher than 1.3 is considered ideal.
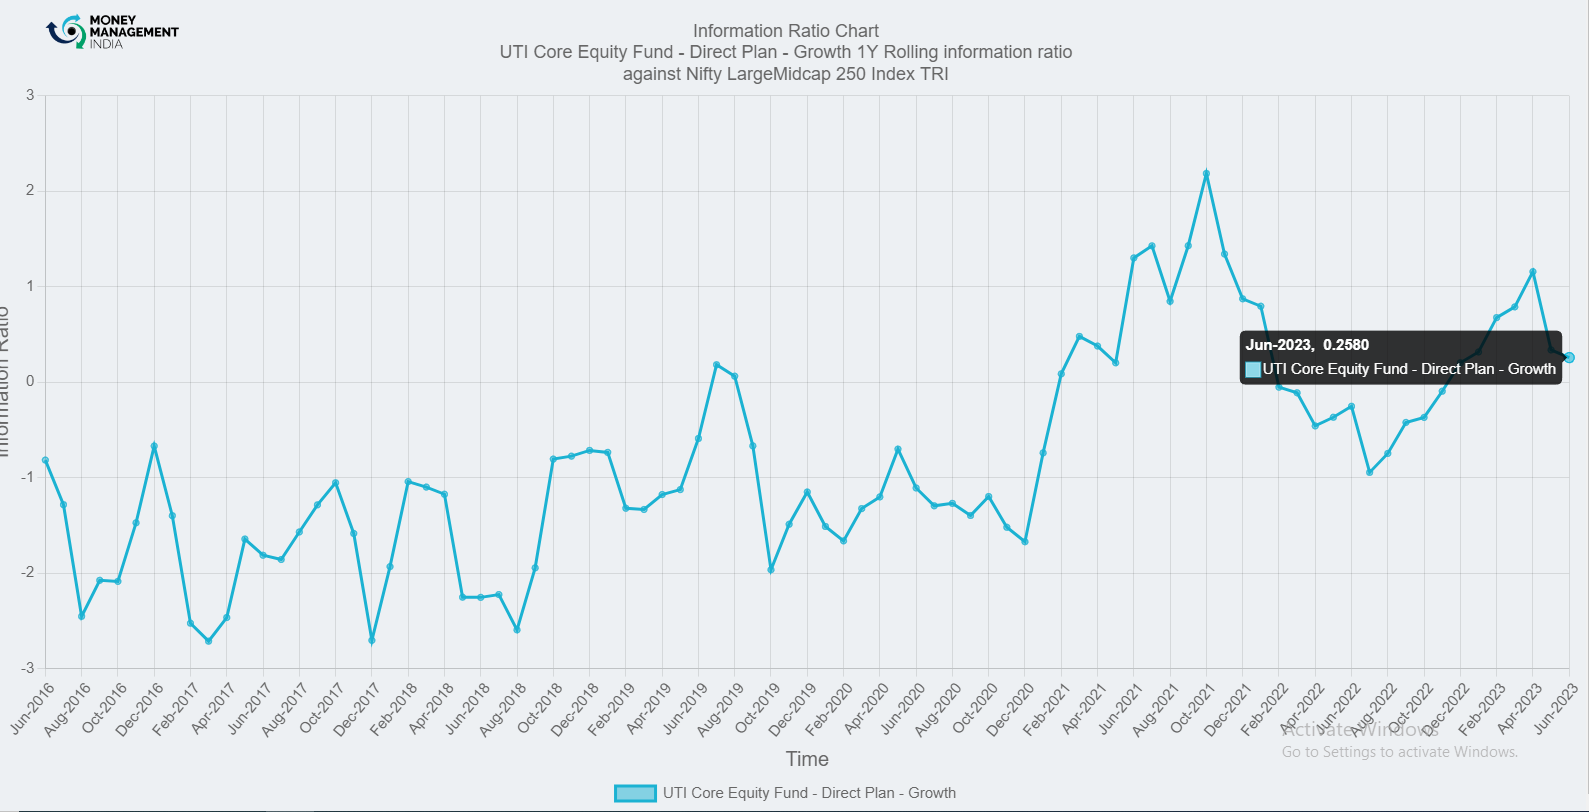
The IR consistently ranges between -2 to 2.5. Fluctuations in information may be due to volatility in TE. A drop in the IR in May 2023 to 0.3380, indicates the fund returns are positive and are closer to the benchmark returns.
Portfolio analysis
Stock style chart
Morningstar’s stock style chart shows the ‘style’ of the stocks in the portfolio in terms of size and value/growth style. The centroid shows the weighted average while the zone circle shows how varied the stock styles are.
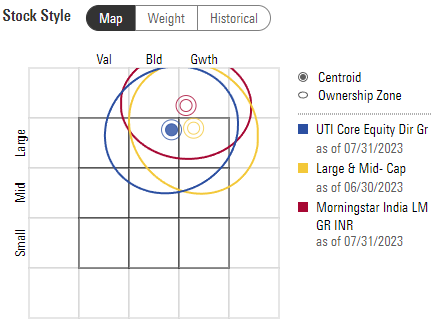
The centroid of the fund states that the fund is a large-cap blended fund. A large proportion of assets allocated is in blended stocks. Low weightage is given to large-cap growth and mid-cap blended stocks.
Factor profile chart
Morningstar’s factor profile shows the historical style analysis of the stocks in the portfolio in terms of size, value/growth style, and other key factors. The blue circle shows the fund relative to the black dot for the category average.

The 5-year historical range indicates this is a blended fund. Capital appreciation is currently below the category level Blended stocks make up a large portion of the portfolio, and yield and liquidity have greater swing indicating variation in the fund style. The capital size of the fund is in the mid-level.
Prepared by Sai Mahesh, August 2023
You must be logged in to post a comment.