ISIN INF966L01648
Overall Analysis
The Rolling returns and IR of the fund seem to be good. The long-run performance of the fund is better than other funds and its own benchmark. The active management’s strategy to add value assets has greatly fluctuated the capital appreciation, which can be seen in the rolling returns.
Performance Analysis
Rolling returns in quartiles
The rolling return chart shows excess 3-year annualized returns in the context of peer return quartiles. The blue line’s time above the third green median line indicates the fund’s better than the median performance of the benchmark.
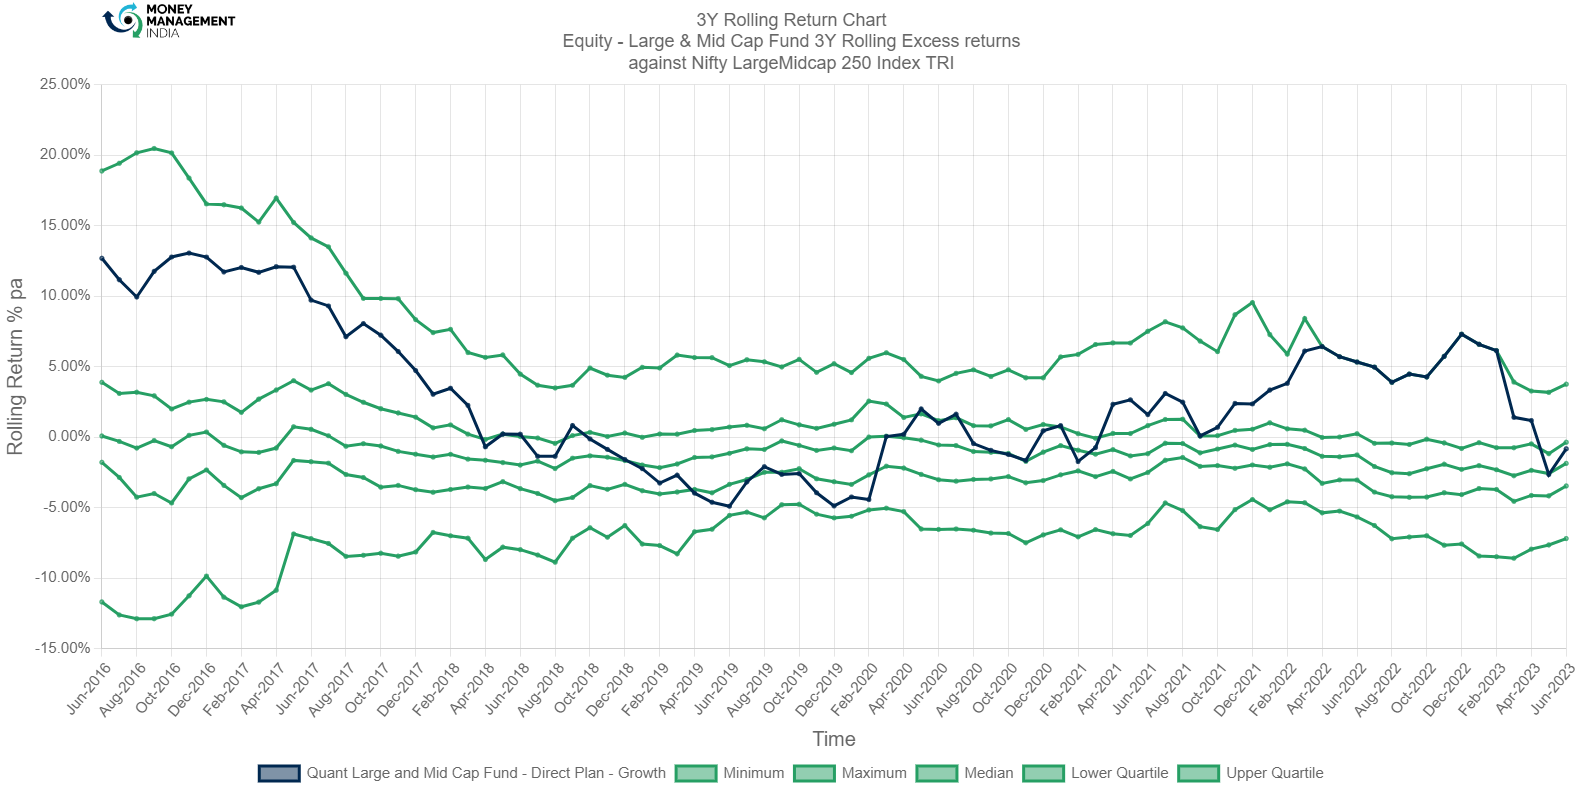
The fund had a performance better than the median. Even the fund can be seen taking over the upper quartile region. From Oct-2021 till Apr-2023, the fund performed better than others and the benchmark. Average returns range from -4.99%- 10%. Currently, the fund holds a rolling return of -0.83% by June 2023.
Rolling Risk/return (snail-trail)
The rolling risk/return chart shows excess 3-year annualized returns relative to the index. The top left quadrant would indicate higher returns with lower volatility than the index.
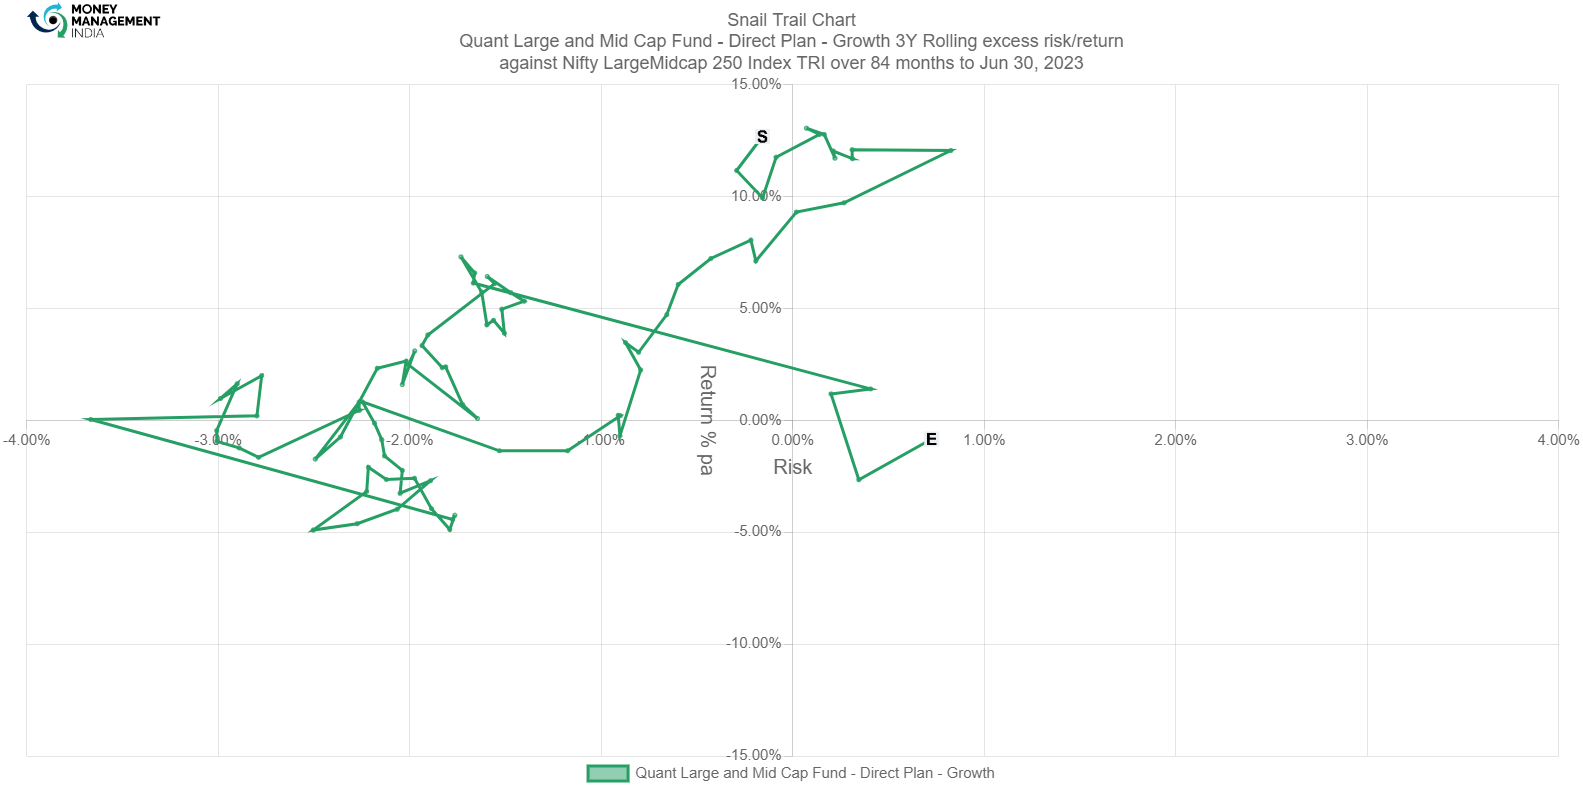
The outperformance with relatively low risk can be till Feb-2023. The fund currently holds a position in the underperformance quartile with relatively high risk with returns at -0.83% and risks at 0.726%, as of June 2023.
Tracking Error
The tracking error chart shows how the fund ‘tracks’ against the index. The higher the TE, the more active the fund’s return has been, with the 2-4% range considered to be barely active, the 4-6% range considered to be reasonably active, and anything higher attributed to concentrated/focused funds. Funds with TE of less than 2% can be considered to be closet indexers.
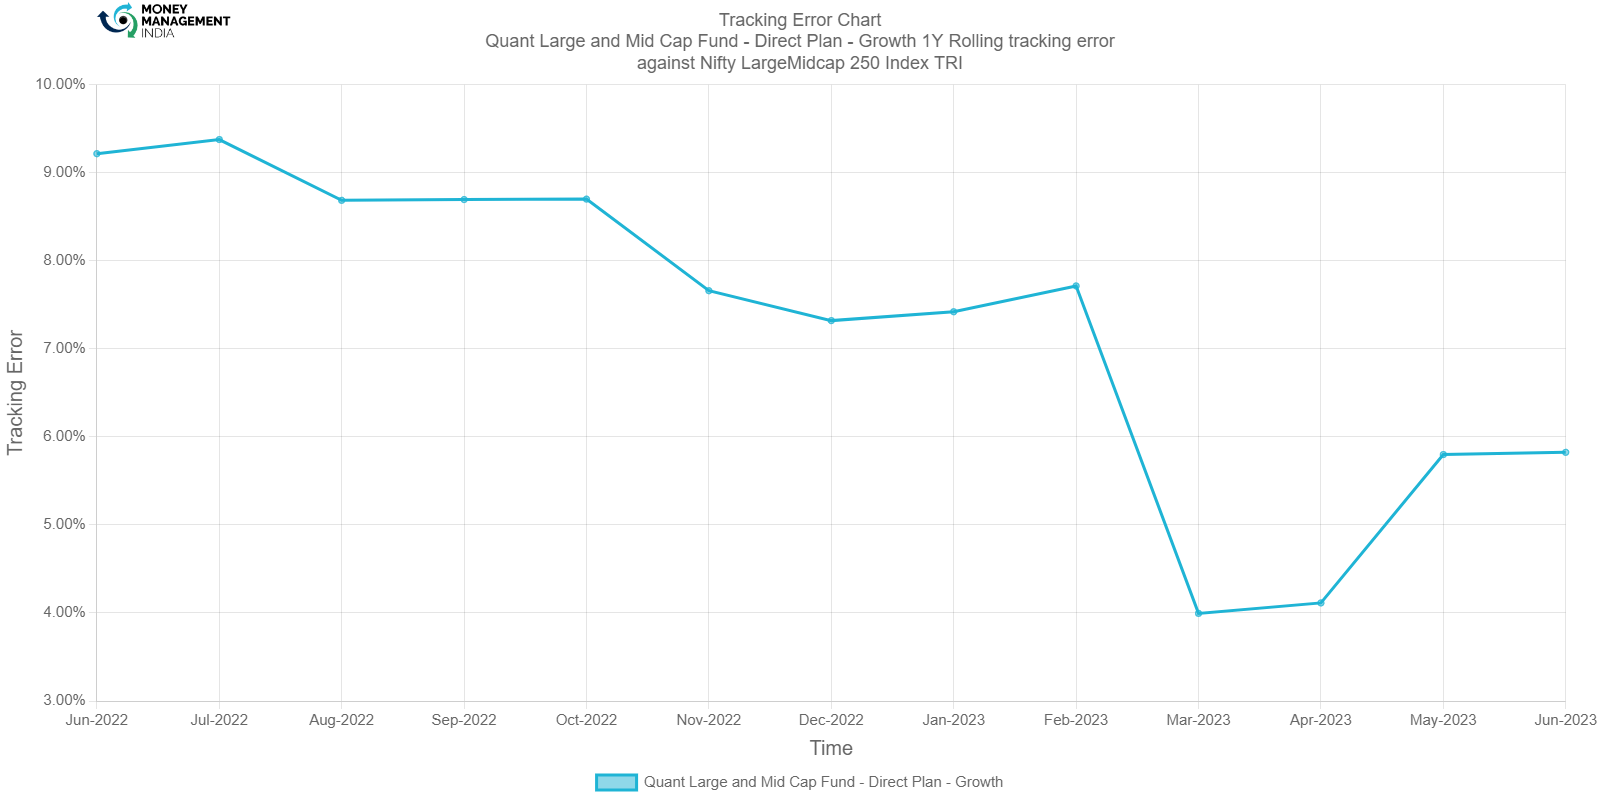
The TE is maintained at a range between 4-6%. This active management fund had the lowest TE in Mar-2023 around 3.9950%.
Information Ratio
The information ratio is a measure of risk-adjusted return as its excess return per excess unit of volatility. Active funds must have an IR higher than 1, higher than 1.3 is considered ideal.
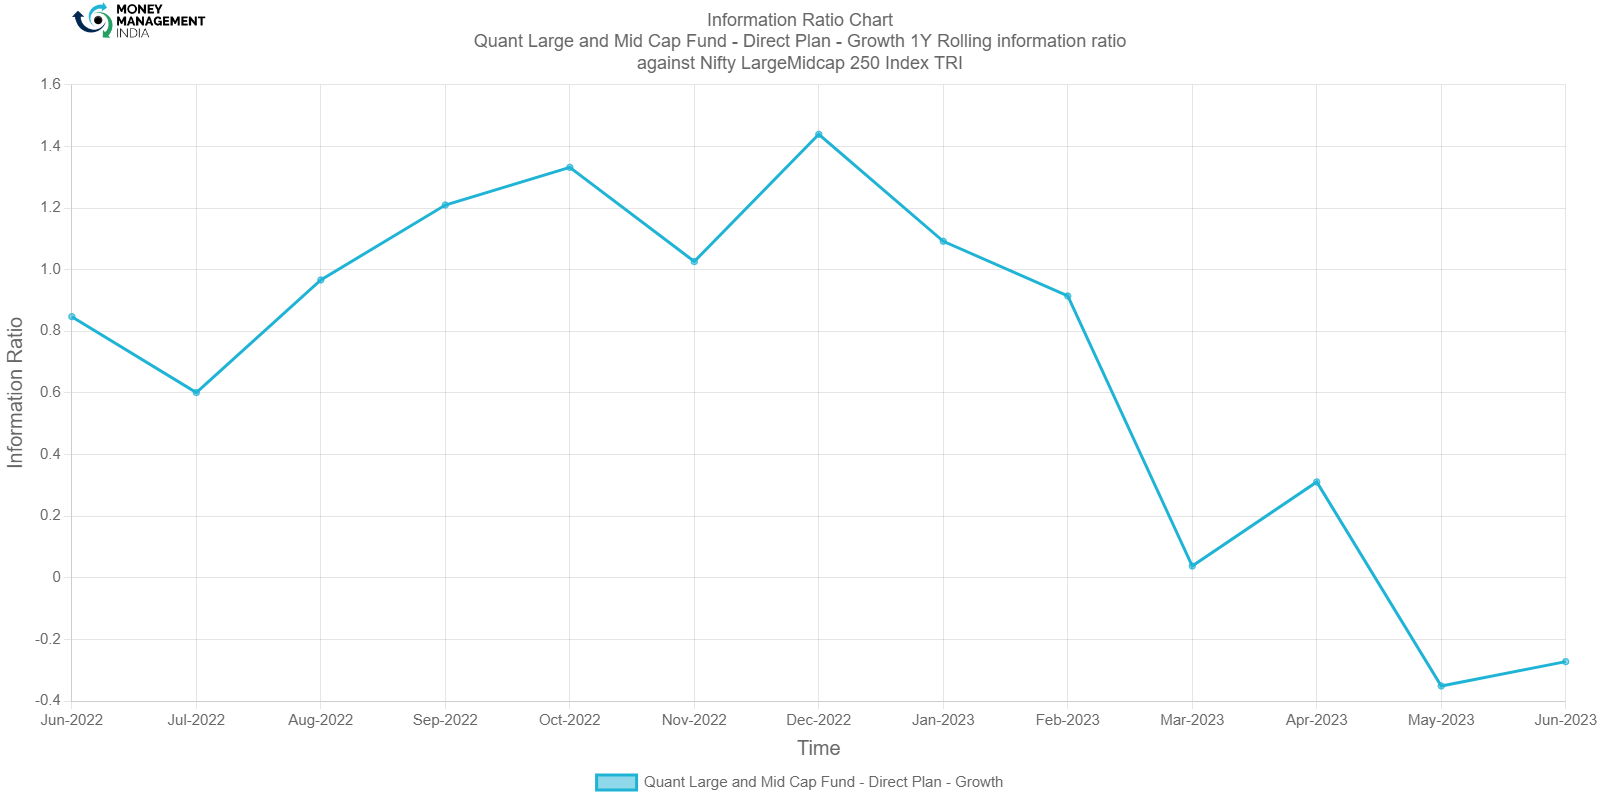
The chart from Jul-2022 till Oct-2022 indicates the fund had a good run. The fund performed better than the benchmark and other funds. A drop in the IR in May 2023, indicates the management of the fund deviated from its benchmark.
Portfolio analysis
Stock style chart
Morningstar’s stock style chart shows the ‘style’ of the stocks in the portfolio in terms of size and value/growth style. The centroid shows the weighted average while the zone circle shows how varied the stock styles are.

The fund maintains a portfolio slightly different than the category average. The fund has adopted a value and growth approach by allocating some value stocks from large-cap and from Mid-cap. No consideration is given to small-cap stocks.
Factor profile chart
Morningstar’s factor profile shows the historical style analysis of the stocks in the portfolio in terms of size, value/growth style, and other key factors. The blue circle shows the fund relative to the black dot for the category average.
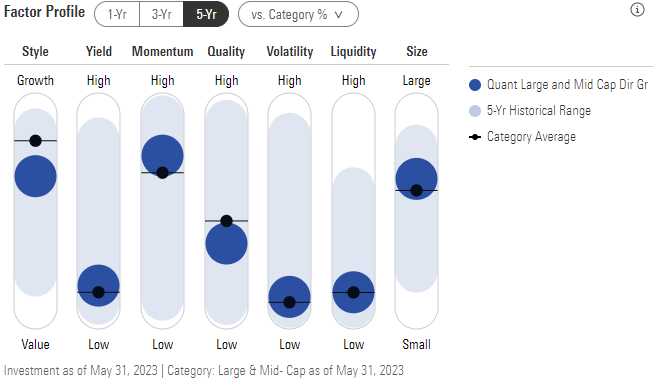
The style factor clearly shows the fund is blended. All factors can be seen with high historical ranges. In the past, the fund has given considerable yield returns. Assets have equally appreciated and depreciated in value as shown in momentum. Significant variation can be seen in quality and volatility. This shows the value-oriented approach of the management. The fund’s capital also varied from large to lower mid and currently has a capital size slightly larger than the category.
Prepared by Sai Mahesh, August 2023
You must be logged in to post a comment.