Performance analysis
Rolling returns in quartiles
The 3 year excess rolling returns are negative across the corporate bond. The blue line is mostly in the 2nd/3rd quartile.

The rolling returns were at its peak with around 2.2% in the month of Dec 2016. Then the rolling returns have not shown much fluctuation from March 2018 to March 2021. As of March 2023, the rolling returns is at -0.5%.
Rolling risk/return (Snail-trail)
The standard deviation on the 3 year excess returns range between -1% to 3%. overall there is high volatility in the fund.
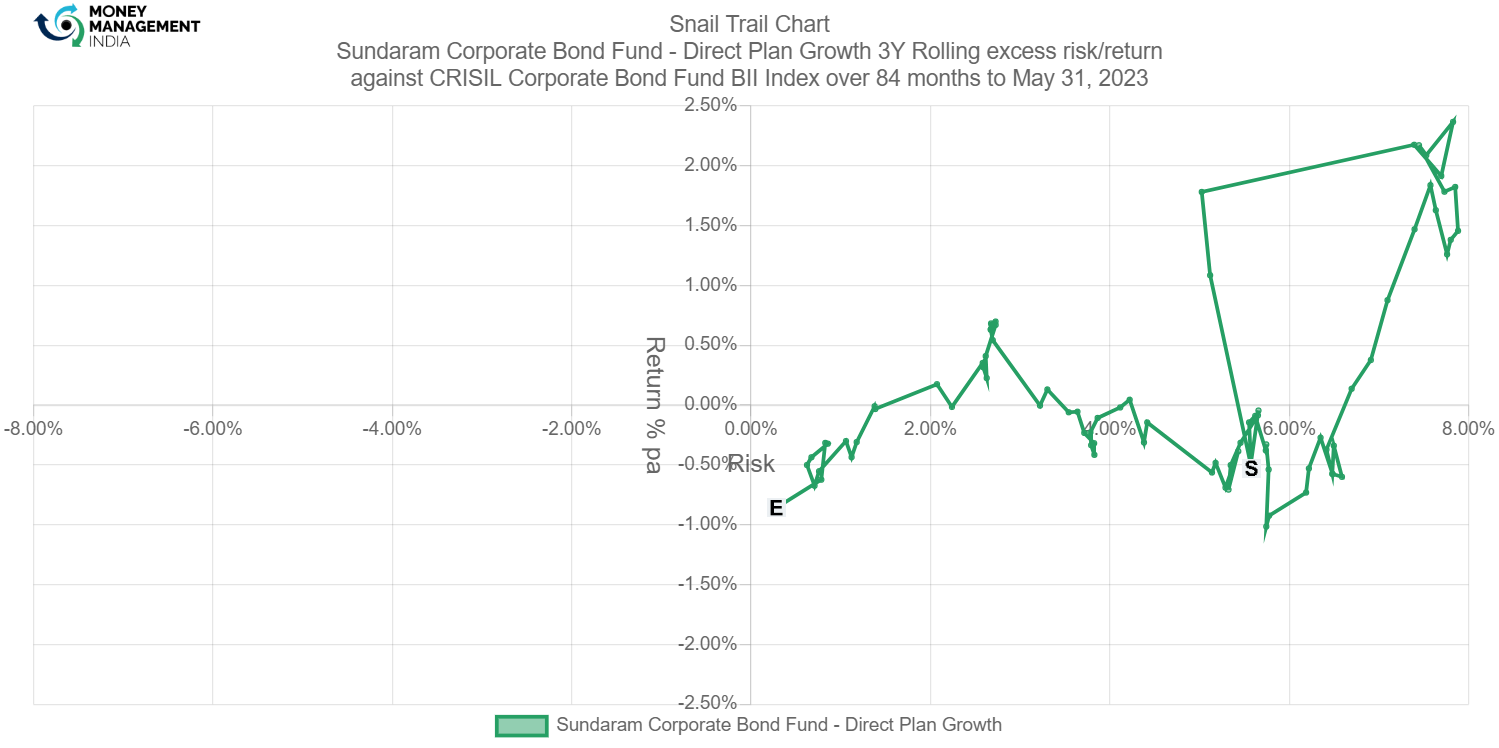
The snail trail shows that when started the fund had negative returns and a higher risk of almost 6%. Now at the end the fund is generating negative returns and a risk of 0.1%.
Tracking error
The tracking error ranges between 0 to 2
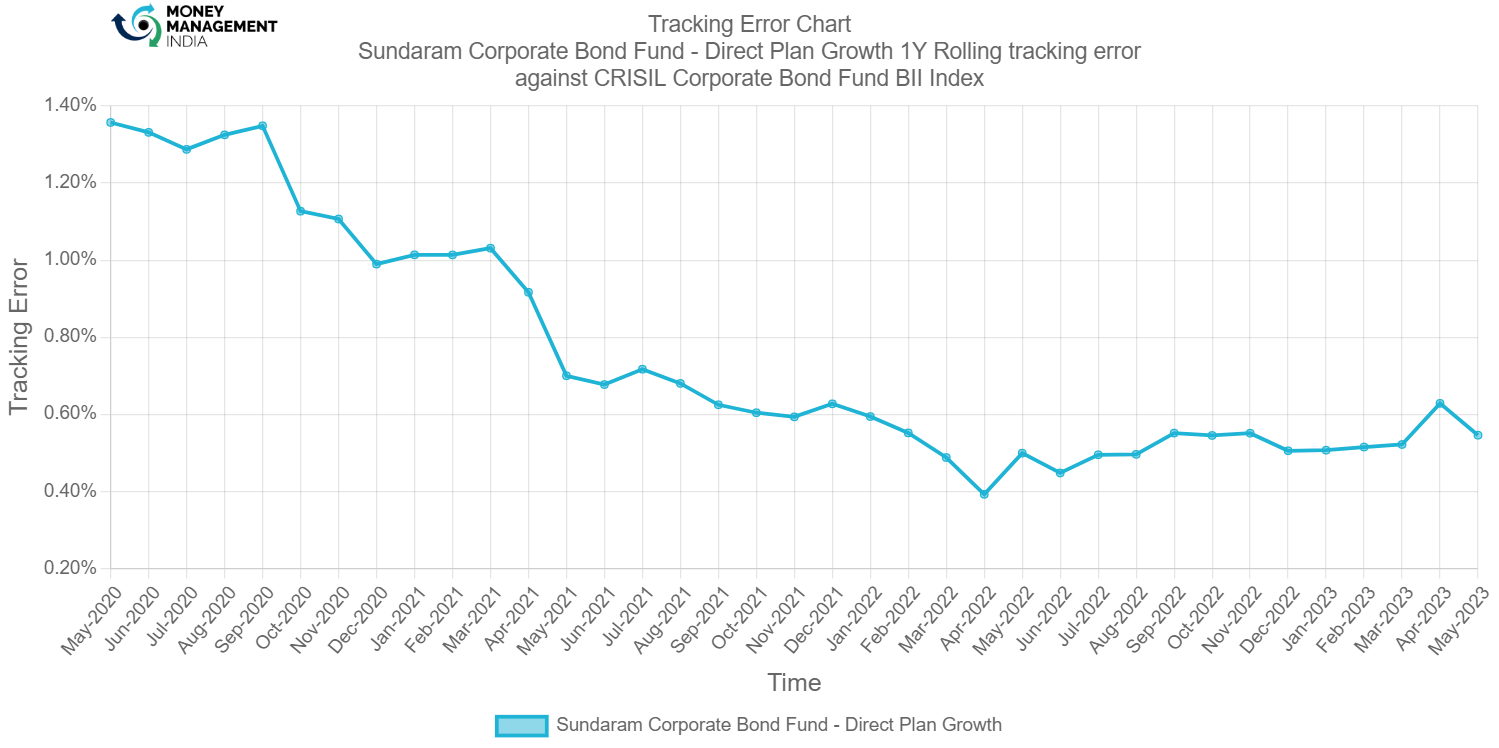
The TE started at 1.35% and then gradually is seen decreasing. As of May 2023, the TE is at 0.55%.
Information ratio
The information ratio ranges between 0 to -3.5. The overall ratio has been mostly below 0.
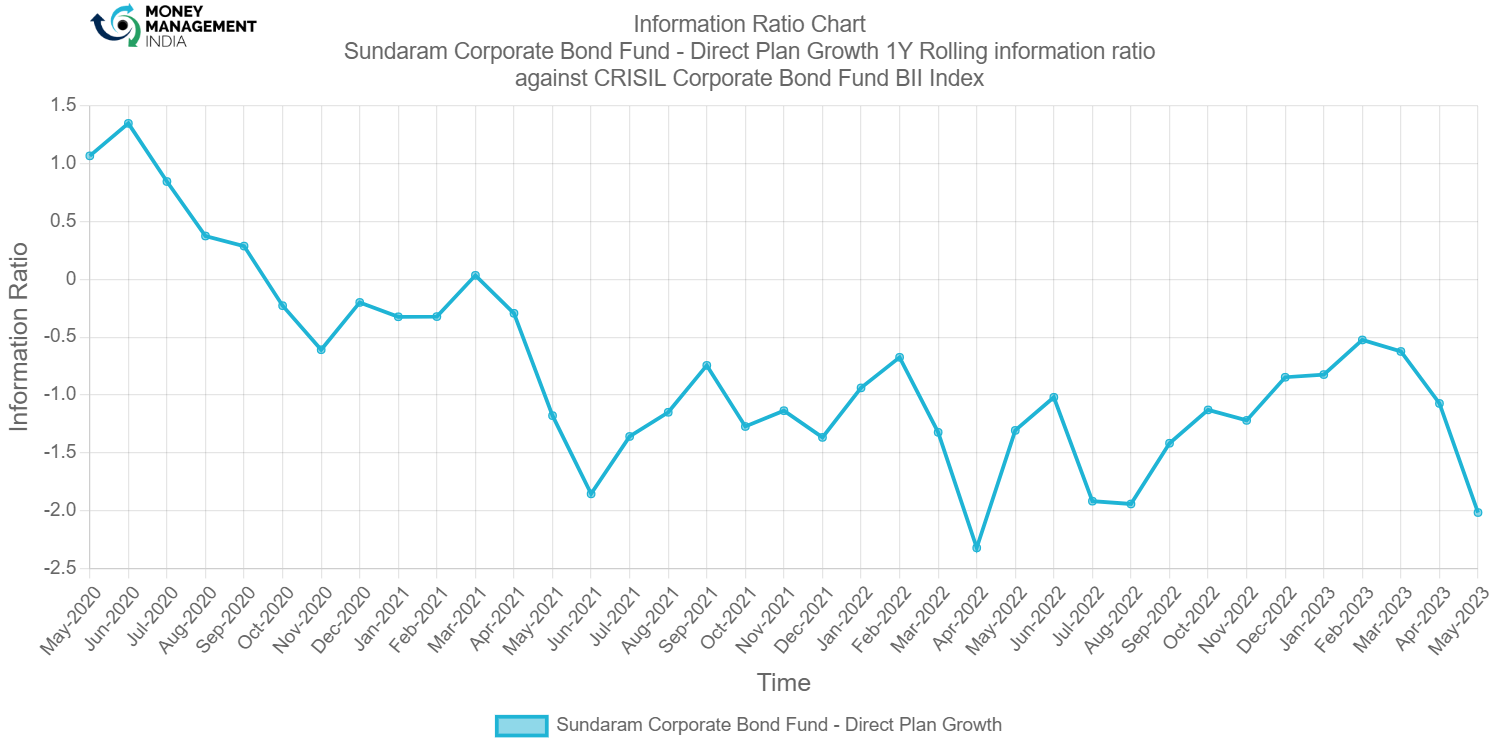
The IR was at its peak with 1.3 in the month of June 2020. Then it started fluctuating gradually and now as of May 2023, the IR is at -2%.
Prepared by – Ganesh Hulke
You must be logged in to post a comment.