Performance analysis
Rolling returns in quartiles
The 3 year excess rolling returns are negative across the corporate bond. The blue line is mostly in the 2nd/3rd quartile.
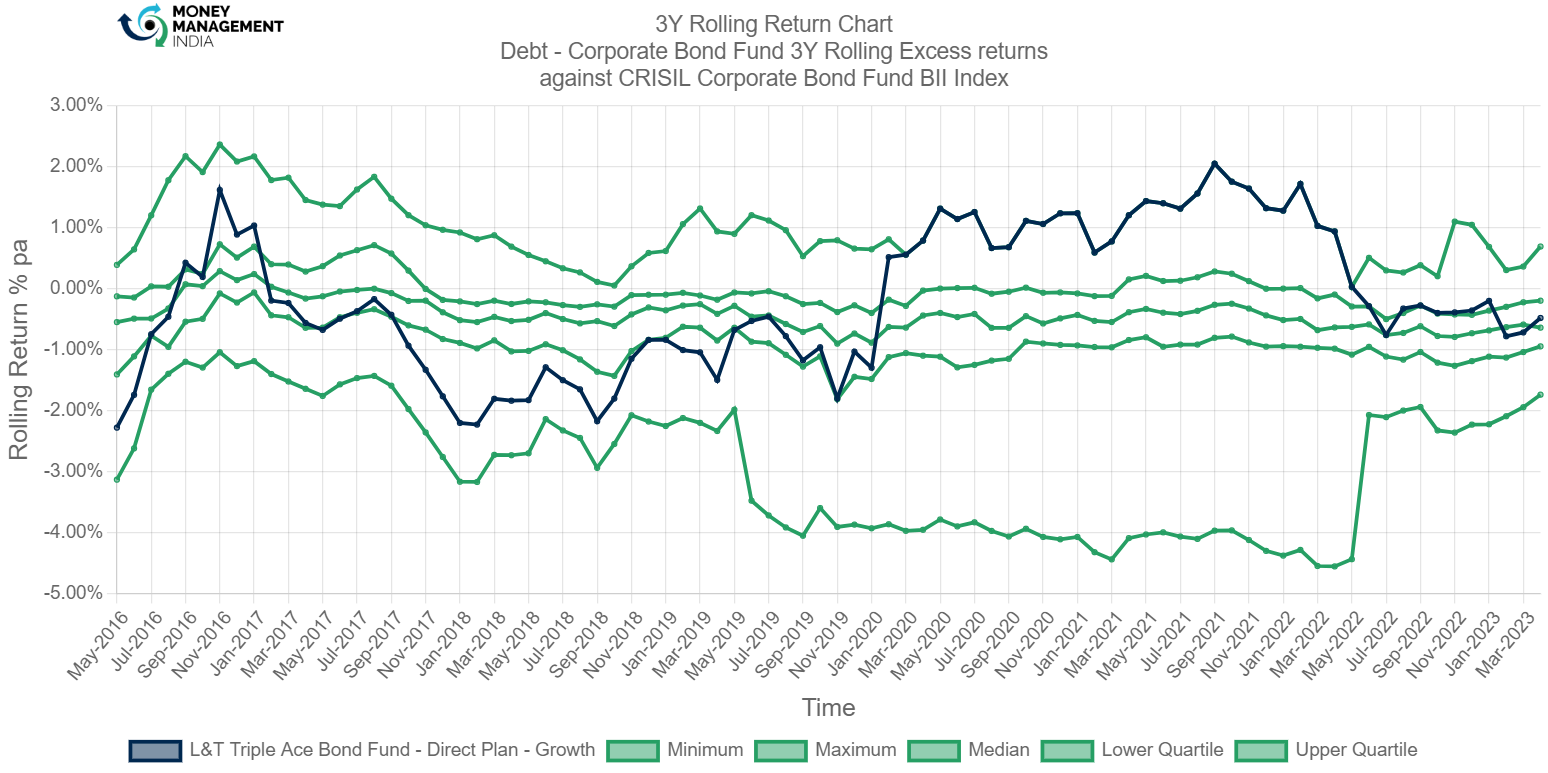
The rolling returns when started was at -2.3%. and as of March 2023, the rolling returns is at -0.5%. The rolling returns were at its peak having 2% in the month of Sep 2021.
Rolling risk/return (Snail-trail)
The standard deviation on the 3 year excess returns range between -1% to 3%. overall there is high volatility in the fund.
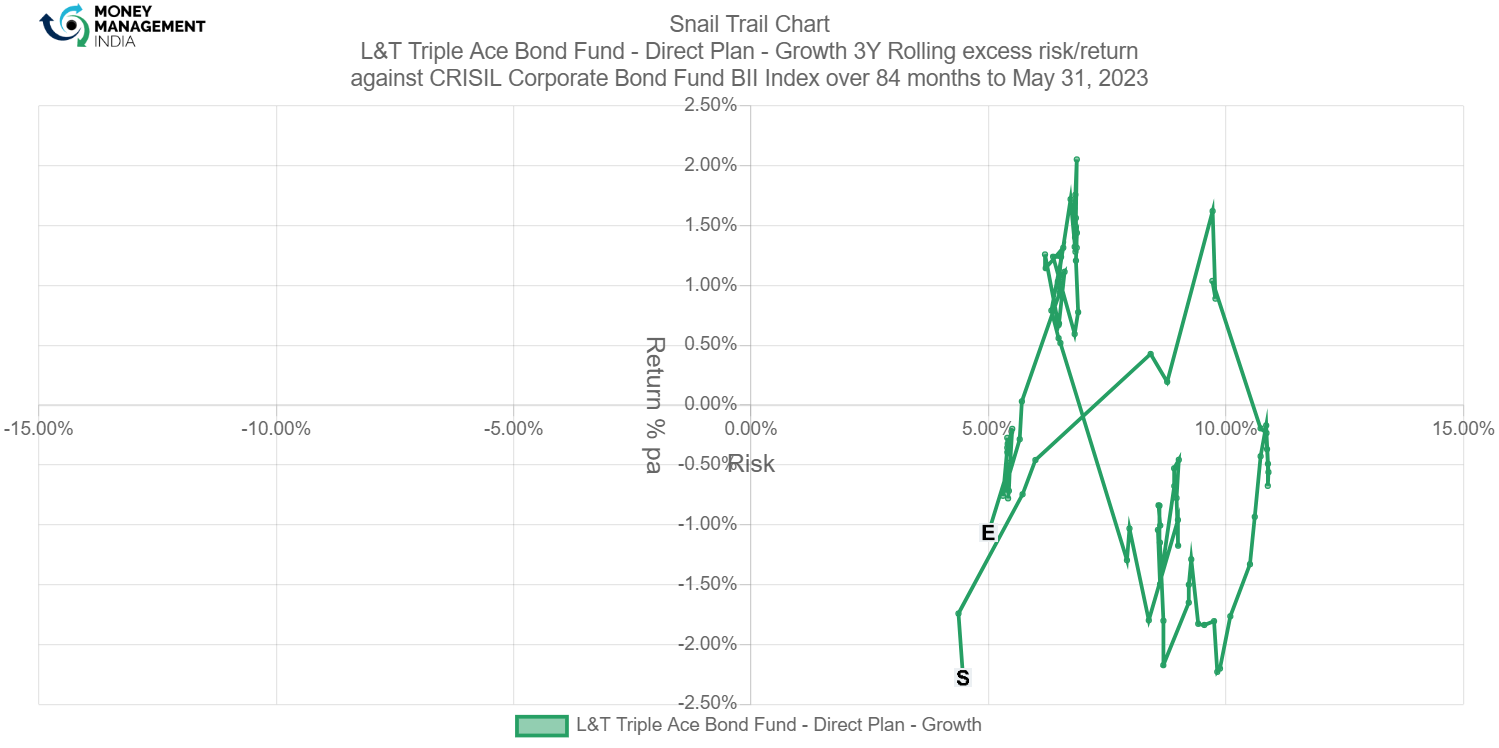
The snail trail of this fund indicates that it was having negative returns at the start and a risk of almost 5%. But now as of May 2023 the same situation continues.
Tracking error
The tracking error ranges between 0 to 2
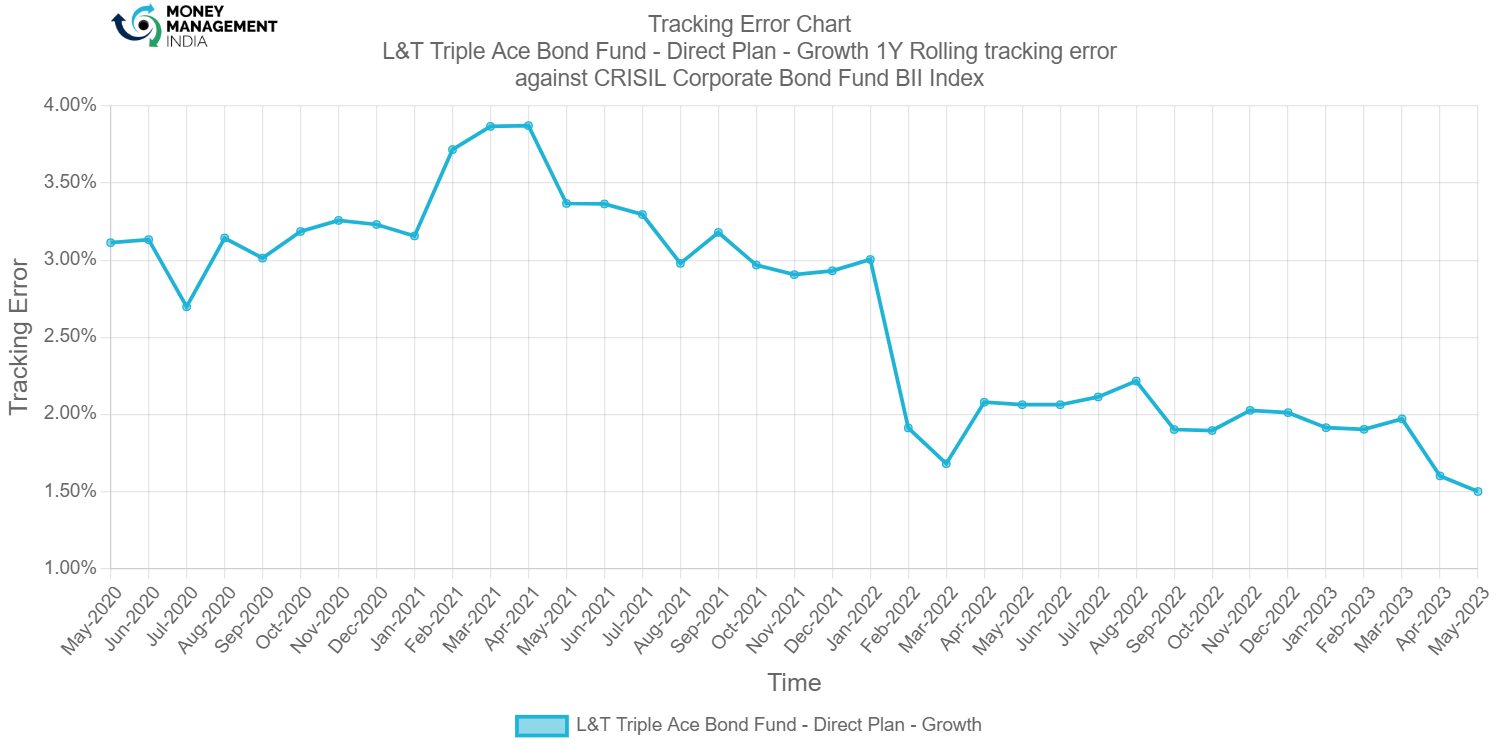
The TE was at its peak in the month of April 2021 having around 3.8% TE. And then it reduced gradually across time. As of May 2023, the TE is at 1.5%.
Information ratio
The information ratio ranges between 0 to -3.5. The overall ratio has been mostly below 0.
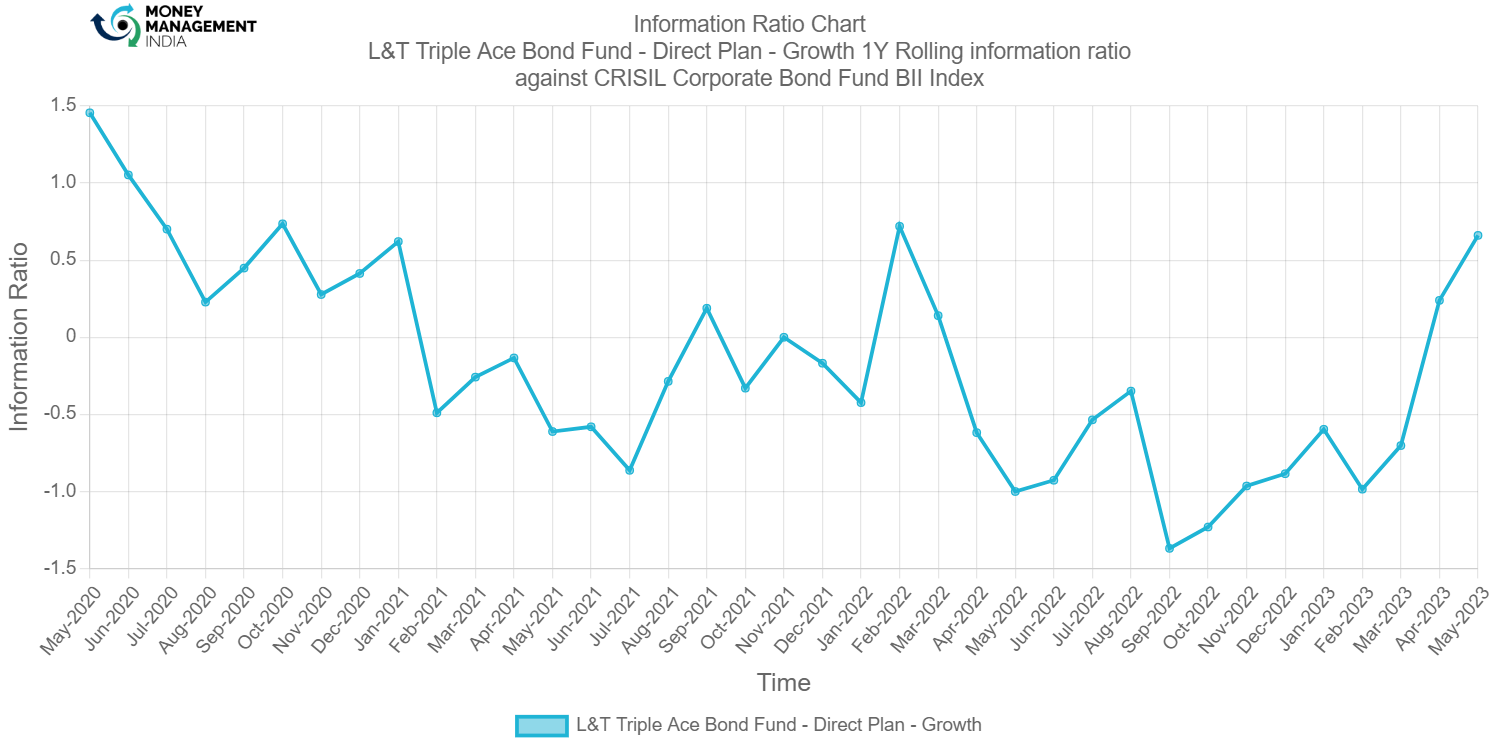
The IR of this fund is seen gradually decreasing across the entire period. As of May 2023 the IR is at 0.6%.
Prepared by – Ganesh Hulke
You must be logged in to post a comment.