ISIN INF204K01F20
Overall Analysis
The Rolling returns and IR of the fund seem to be good. The long-run performance of the fund is better than other funds and its own benchmark. The active management’s strategy to add value assets has greatly fluctuated the capital appreciation, which can be seen in the rolling returns.
Performance Analysis
Rolling returns in quartiles
The rolling return chart shows excess 3-year annualized returns in the context of peer return quartiles. The blue line’s time above the third green median line indicates the fund’s better than the median performance of the benchmark.
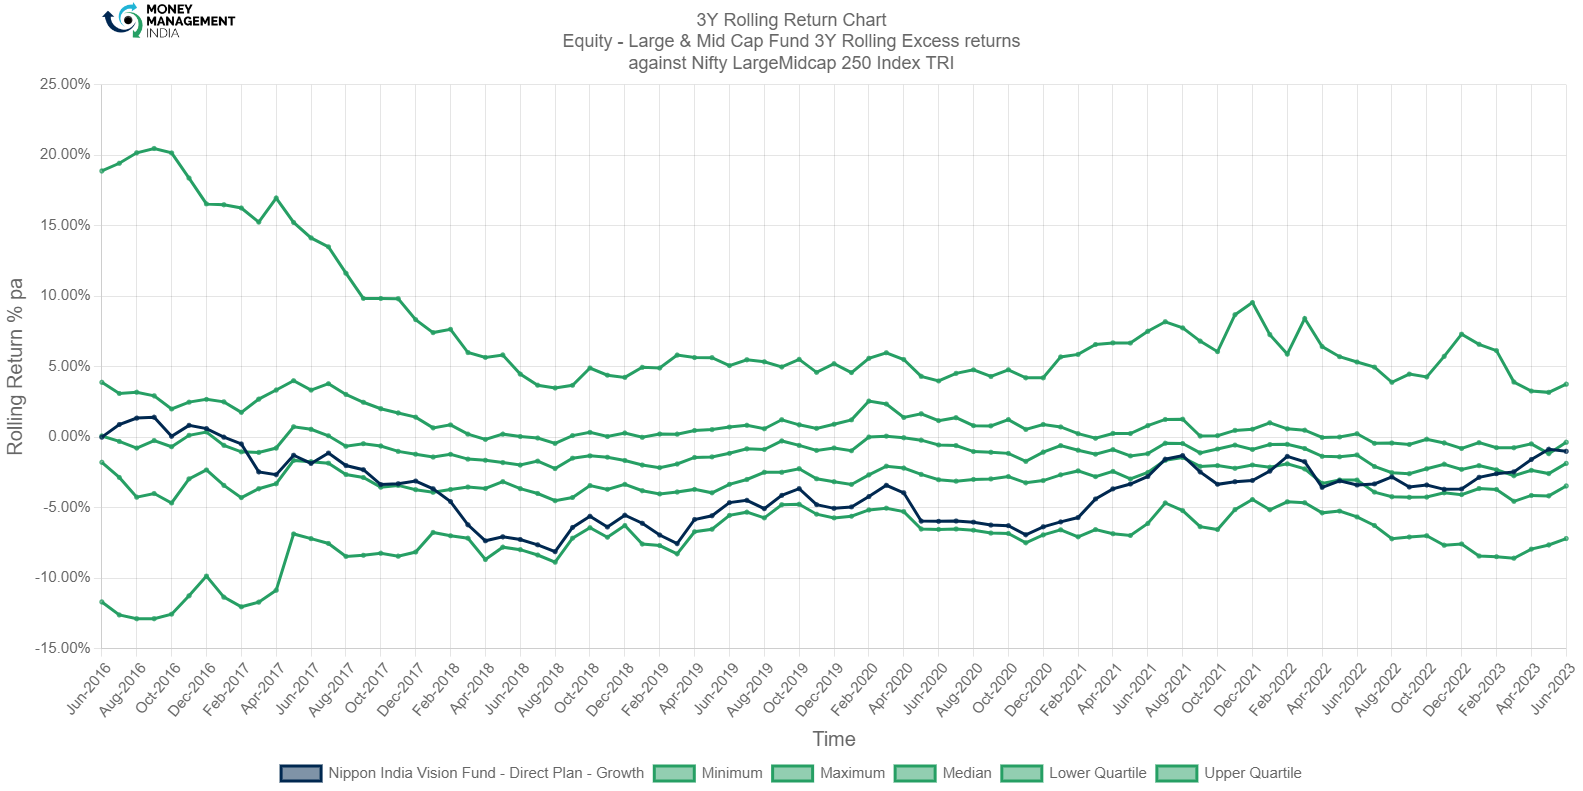
The 3-year rolling returns show that the median performed better than the fund. However, it can be seen that the fund and the benchmark together have been in the lower quartile for quite a long time. The fund’s performance surpassed the median only a couple of times.
Rolling Risk/return (snail-trail)
The rolling risk/return chart shows excess 3-year annualized returns relative to the index. The top left quadrant would indicate higher returns with lower volatility than the index.
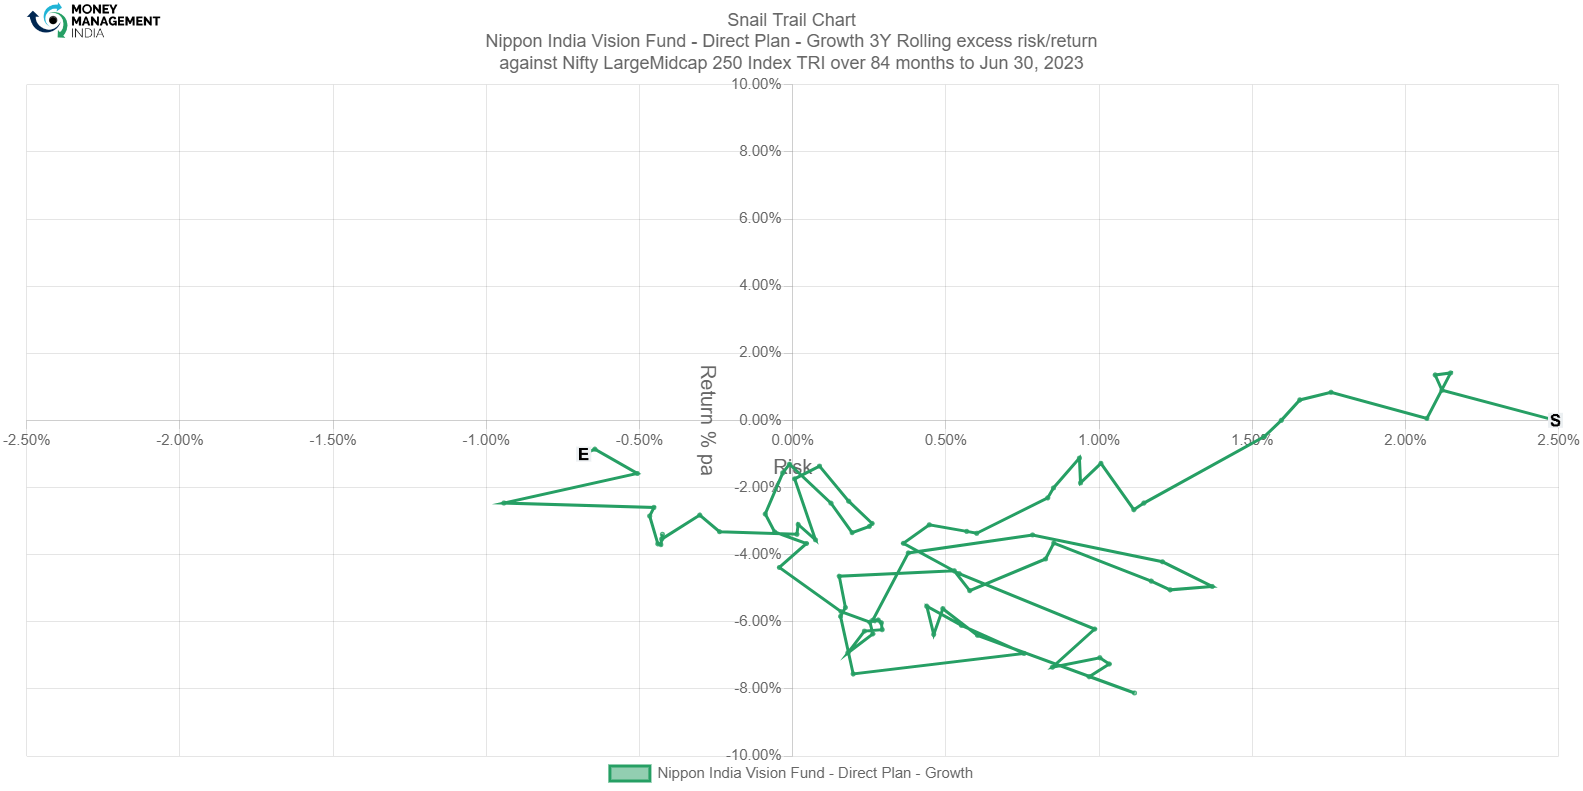
This fund’s 3-year rolling returns have always been on the lower quartile of underperformance. The fund outperformed the benchmark initially, but later the performance was constant in the lower quartile region. The highest return the fund has ever seen is in Sep 2016 with 1.42%.
Tracking Error
The tracking error chart shows how the fund ‘tracks’ against the index. The higher the TE, the more active the fund’s return has been, with the 2-4% range considered to be barely active, the 4-6% range considered to be reasonably active, and anything higher attributed to concentrated/focused funds. Funds with TE of less than 2% can be considered to be closet indexers.

TE is at an average level between 3-6 %. The fund follows an active-passive strategy, currently, the fund is passively managed. As of June 2023, the TE of the fund is 3.4000%
Information Ratio
The information ratio is a measure of risk-adjusted return as its excess return per excess unit of volatility. Active funds must have an IR higher than 1, higher than 1.3 is considered ideal.
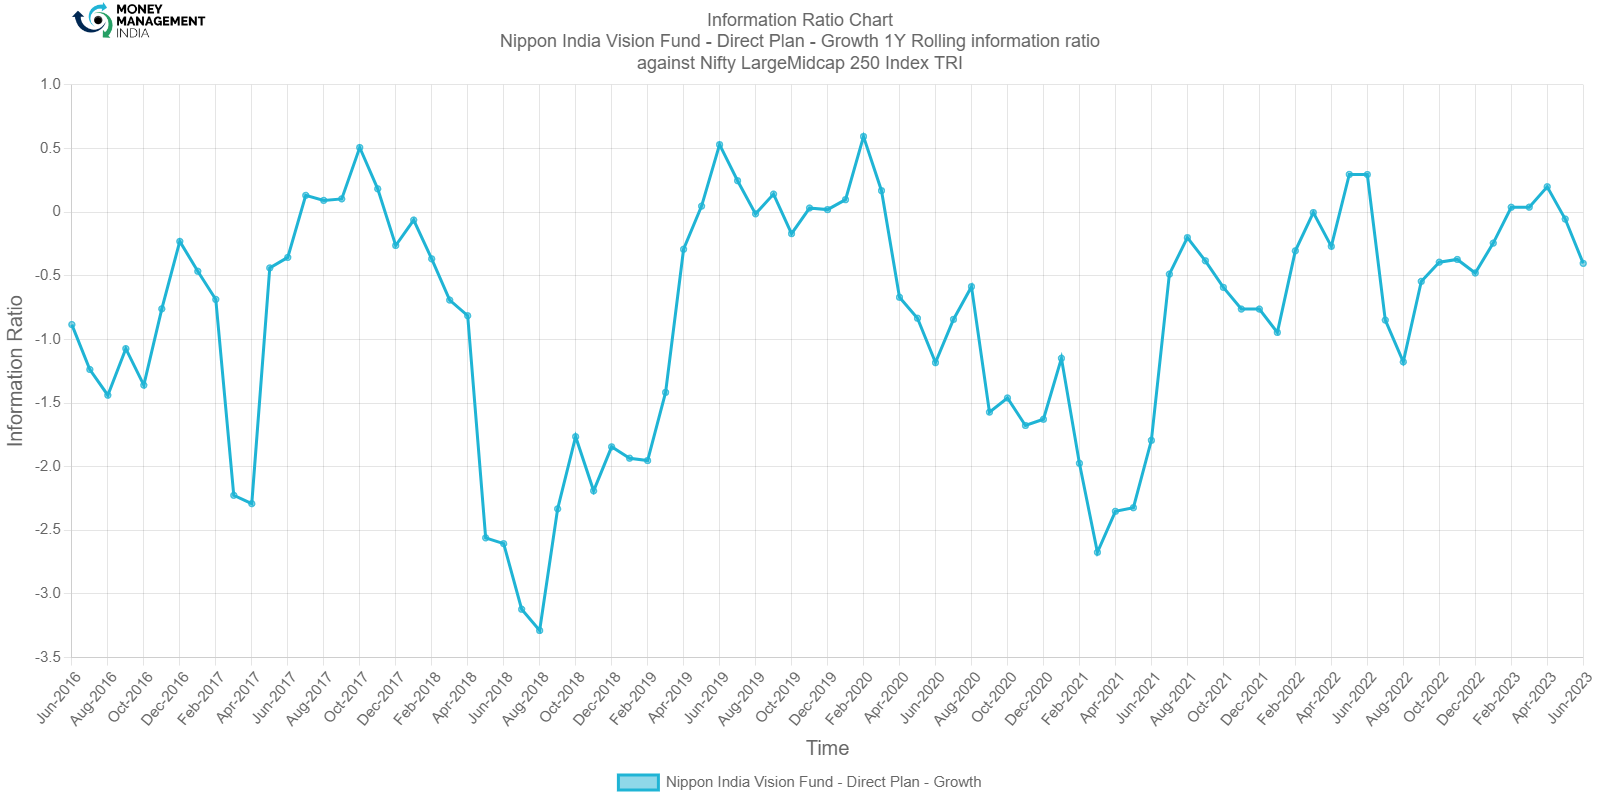
IR of this fund does not look promising as it barely achieved a high of 0.5940 in Feb-2020. As ofJun-2023 the IR is at -0.4030.
Portfolio analysis
Stock style chart
Morningstar’s stock style chart shows the ‘style’ of the stocks in the portfolio in terms of size and value/growth style. The centroid shows the weighted average while the zone circle shows how varied the stock styles are.
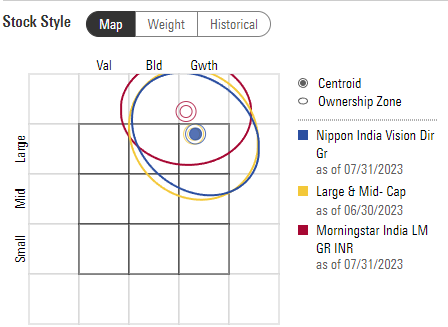
The weighted average of the fund is closely related to that of the category average. Blended and growth make up the largest asset classification in this fund. It ranges from large cap to mid-cap.
Factor profile chart
Morningstar’s factor profile shows the historical style analysis of the stocks in the portfolio in terms of size, value/growth style, and other key factors. The blue circle shows the fund relative to the black dot for the category average.
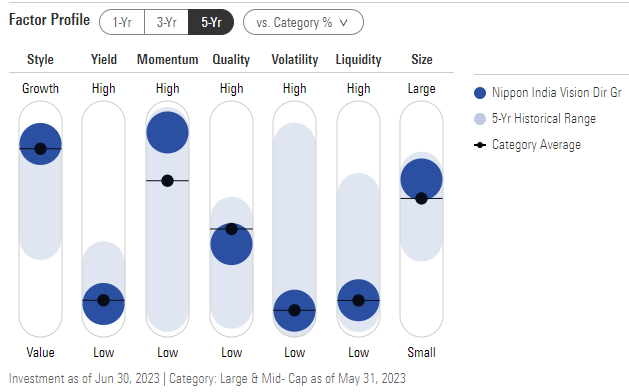
All factors of this fund have great historical ranges, as large blended stocks make up most of the portfolio. The style factor indicates that the fund fluctuated between growth and value. Low yield and high momentum show that the growths of assets are better than the category. Quality and volatility have great variations indicating the assets’ performance has been low. The fund has a capital size slightly larger than the category average.
Prepared by Sai Mahesh, August 2023
You must be logged in to post a comment.