ISIN INF090I01FW8
Performance analysis
Rolling returns in quartiles
The 3 year excess rolling returns are negative across the corporate bond. The blue line is mostly in the 2nd/3rd quartile.
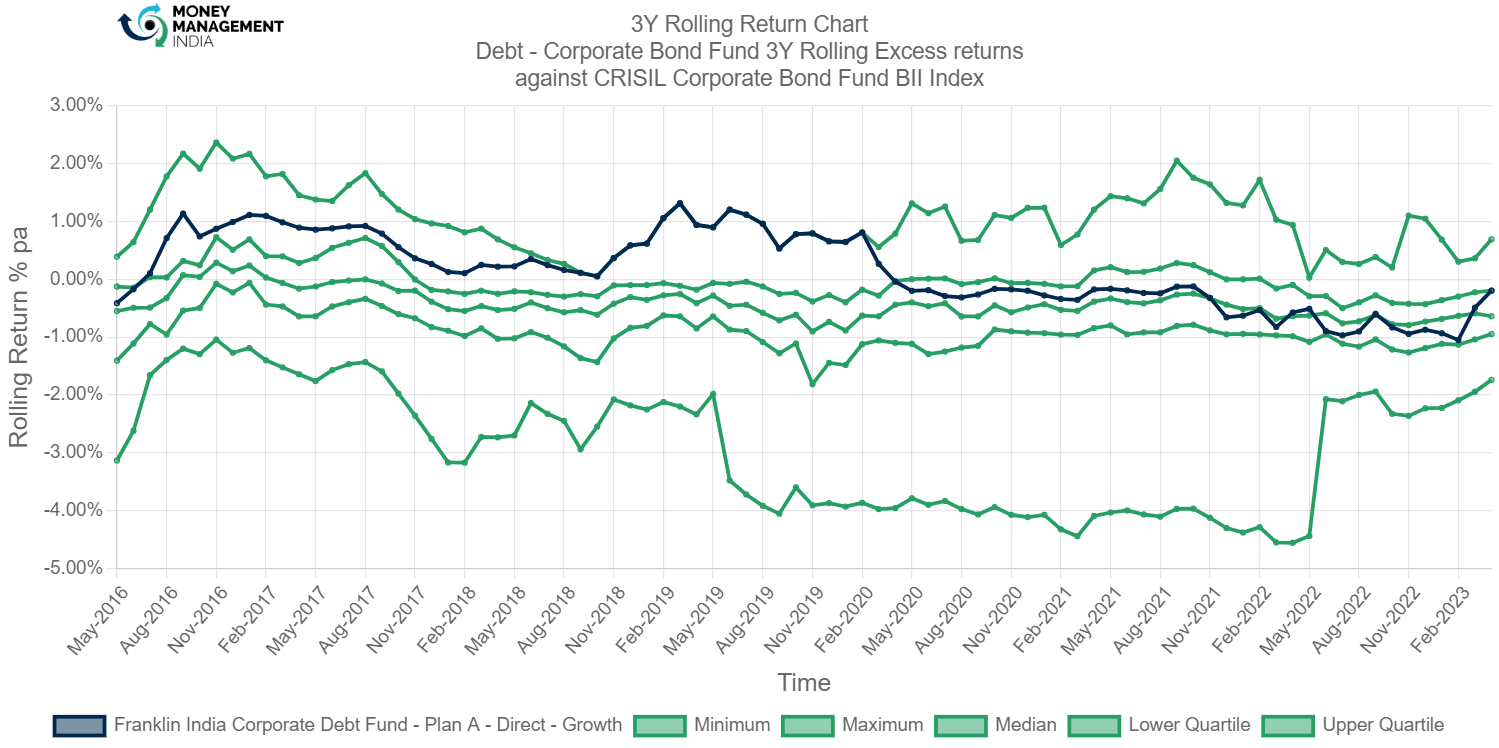
The funds rolling returns were positive for the period of Aug 2016 to May 2020. The fund was out performing in that period. Later that the fund fell to give negative returns of almost -1 % in the month of Feb 2023.
Rolling risk/return (Snail-trail)
The standard deviation on the 3 year excess returns range between -1% to 3%. overall there is high volatility in the fund.

The fund has a comparatively higher risk of about 2.5 % and now the risk has reduced to 0.5 %. But the returns were negative at the start and also at the end.
Tracking error
The tracking error ranges between 0 to 2

The TE was always positive for this fund. It was at its peak of around 2.50 % at the start in May 2020. Then it jumped down by almost 2 % from 1.8 % to 0.7 % in the month of March 2021 within 2 months. As of May 2023 the TE is at 0.3 %.
Information ratio
The information ratio ranges between 0 to -3.5. The overall ratio has been mostly below 0.
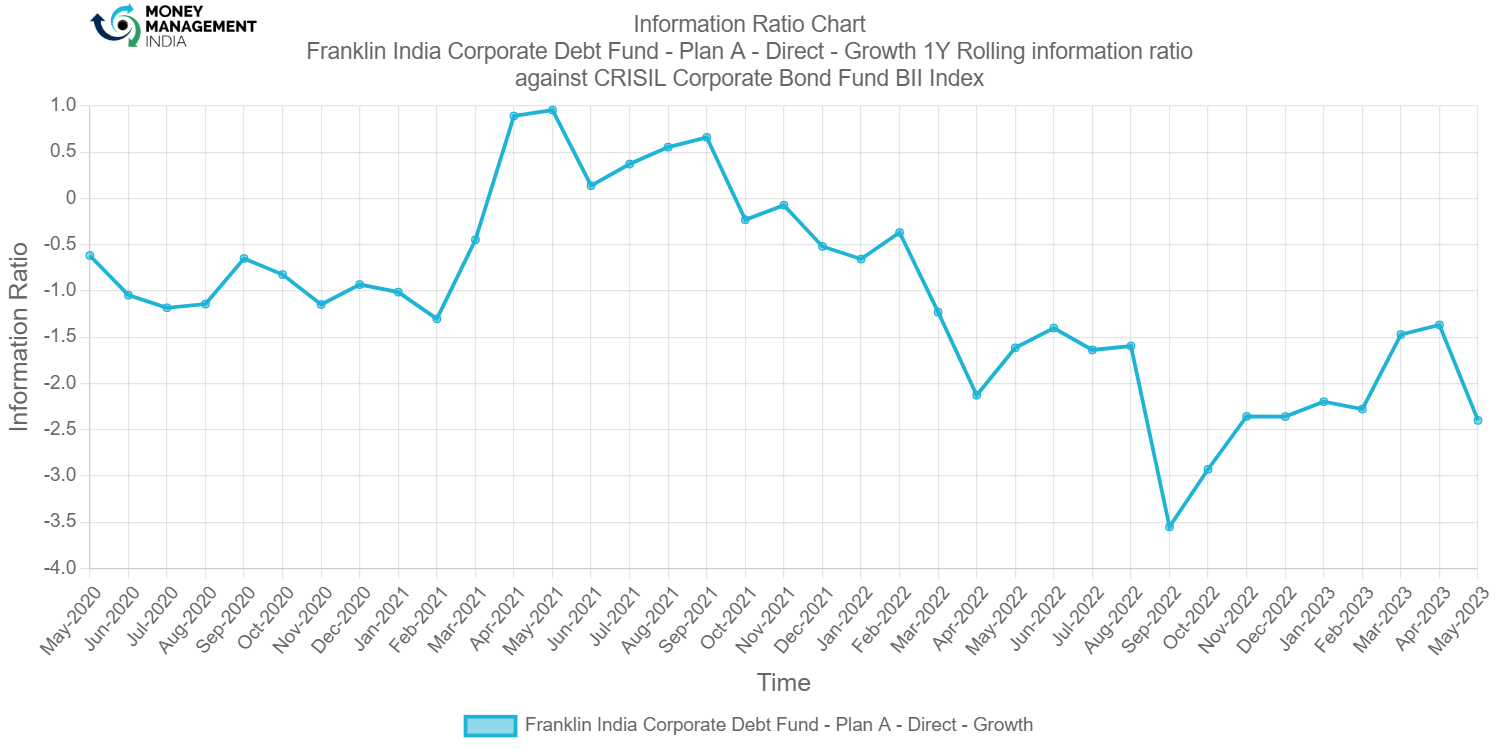
The IR was positive only for a short period from April 2021 to Oct 2021. For the rest of the period the IR was always negative. The IR also went down to -3.5 % in the month of Sep 2022.
Prepared by – Ganesh Hulke
You must be logged in to post a comment.