Performance analysis
Rolling returns in quartiles
The 3 year excess rolling returns are negative across the corporate bond. The blue line is mostly in the 2nd/3rd quartile.

The rolling returns for the entire period were consistent. It was always in between -1 to +1. The fund was in the 1st and 2nd quartile.
Rolling risk/return (Snail-trail)
The standard deviation on the 3 year excess returns range between -1% to 3%. overall there is high volatility in the fund.

At the start the fund generated positive returns and also had lower volatility. Now the fund gives negative returns and risk is also around 0.1%.
Tracking error
The tracking error ranges between 0 to 2

The TE was at its peak 1.38 % in the month of Dec 2020 and gradually decreased to 0.75% in the month of May 2023.
Information ratio
The information ratio ranges between 0 to -3.5. The overall ratio has been mostly below 0.
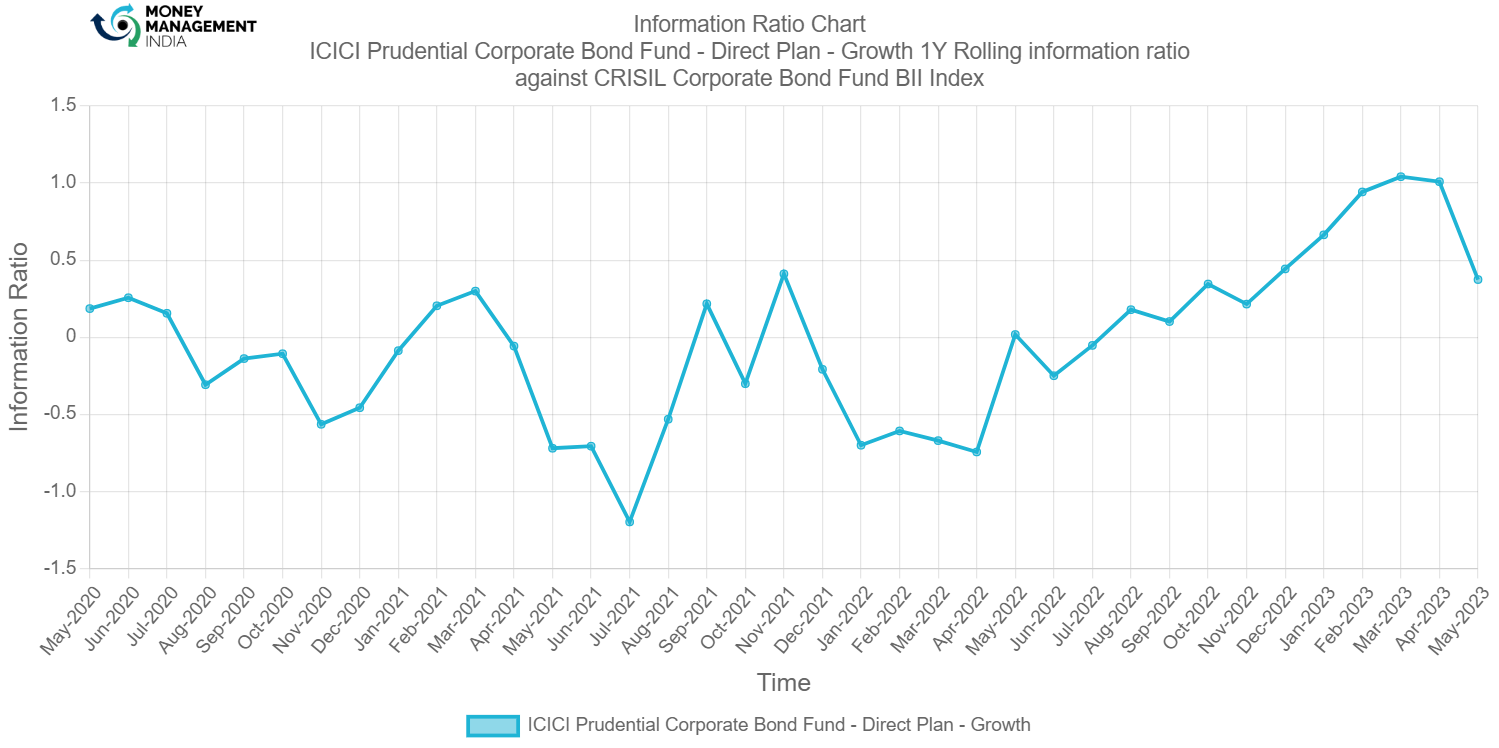
The IR was fluctuating more. As of May the IR is at 0.4 %.
Prepared by – Ganesh Hulke
You must be logged in to post a comment.