ISIN INF769K01BI1
Overall Analysis
The fund performed better than the benchmark and its peers. In the long run, the fund can be seen earning impressive returns and even surpassing the benchmark. The 3-year rolling returns and IR show the active fund is good at generating risk-adjusted returns.
Performance Analysis
Rolling returns in quartiles
The rolling return chart shows excess 3-year annualized returns in the context of peer return quartiles. The blue line’s time above the third green median line indicates the fund’s better than the median performance of the benchmark.
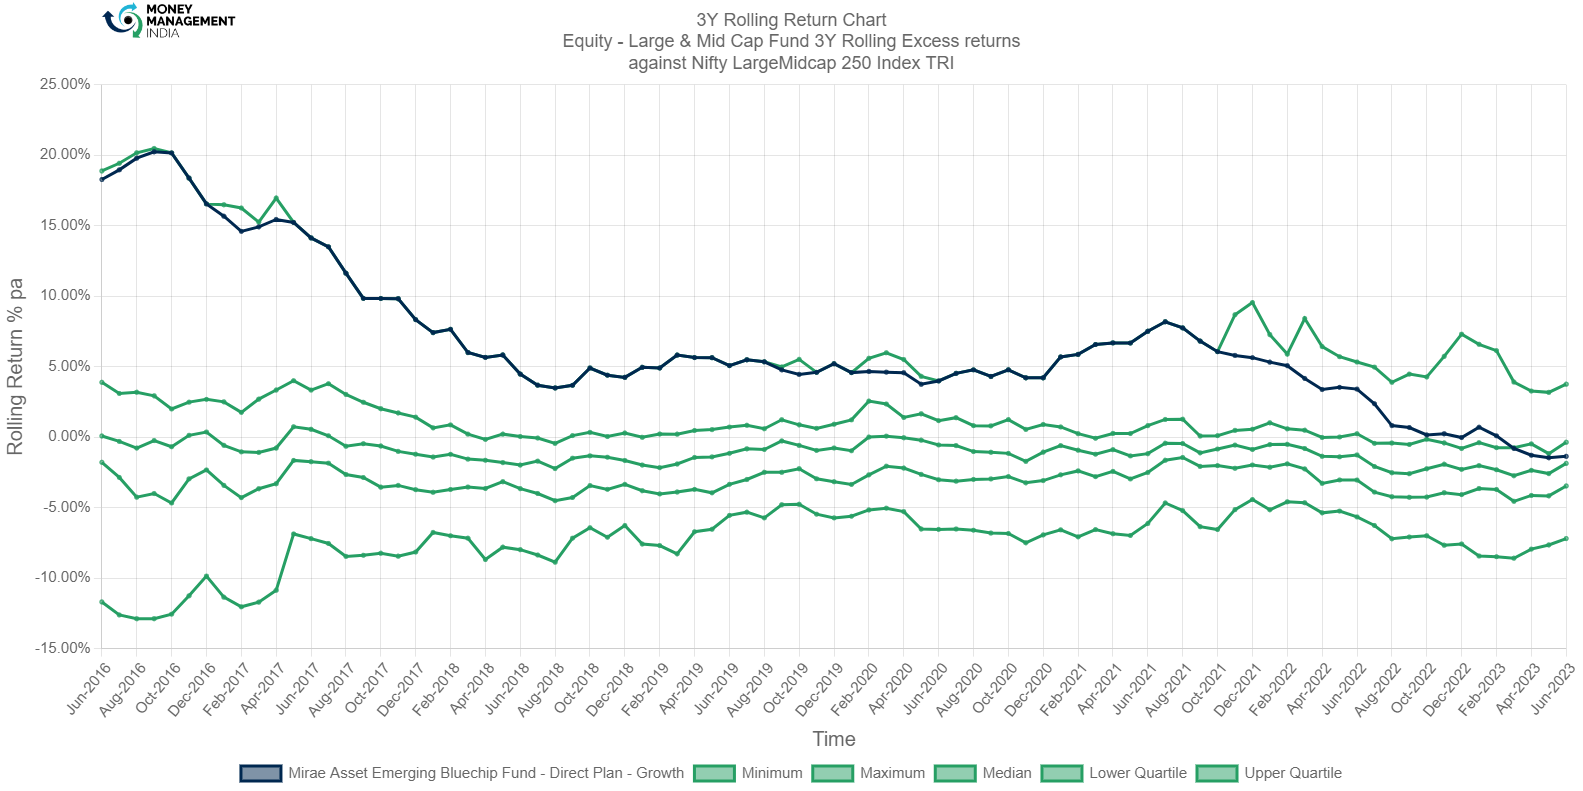
The 3-year rolling returns clearly show that the fund outperformed the benchmark to a great extent. On Sep 2016, the fund achieved an all-time high of 20.25%. The fund maintained its position above the median and in the upper quartile region. The positive performance of the fund is seen till Oct 2021. The fund as of Jun-2023 holds a return of -1.36%.
Rolling Risk/return (snail-trail)
The rolling risk/return chart shows excess 3-year annualized returns relative to the index. The top left quadrant would indicate higher returns with lower volatility than the index.
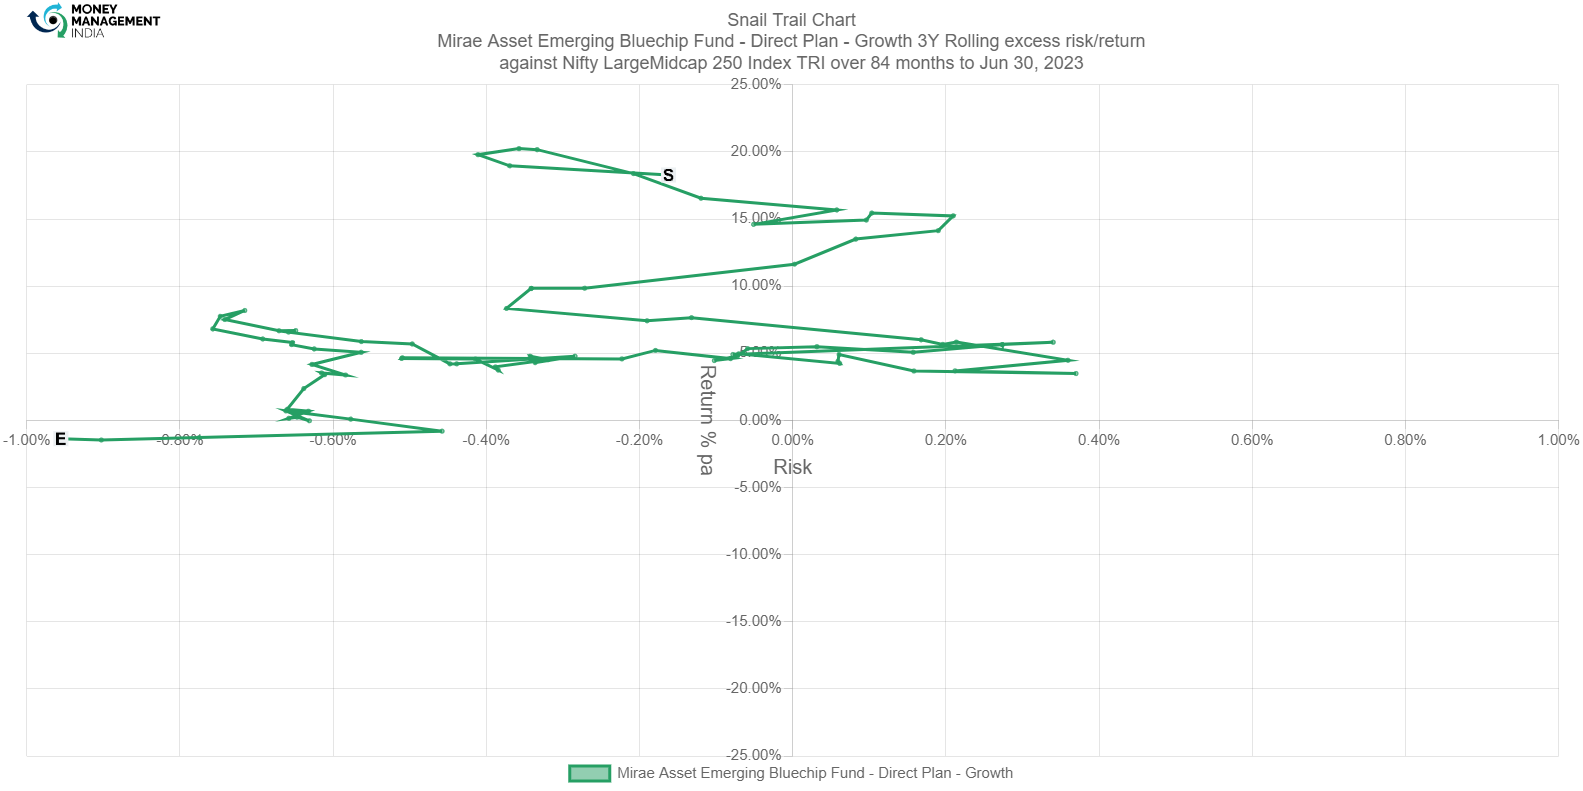
This active fund outperformed the index with returns ranging between 0.5-20%. The fund can be seen facing a downfall from Feb 2023 with a risk level of -0.577%. The fund’s return and risk level as of Jun-2023 stands at -1.36% and -0.956%.
Tracking Error
The tracking error chart shows how the fund ‘tracks’ against the index. The higher the TE, the more active the fund’s return has been, with the 2-4% range considered to be barely active, the 4-6% range considered to be reasonably active, and anything higher attributed to concentrated/focused funds. Funds with TE of less than 2% can be considered to be closet indexers.

The volatility in the TE shows the fund is active. With TE ranging from 2-4%, the fund can be either more concentrated or actively managed. Aug-2022 has seen a high TE of 3.9480%.
Information Ratio
The information ratio is a measure of risk-adjusted return as its excess return per excess unit of volatility. Active funds must have an IR higher than 1, higher than 1.3 is considered ideal.

The increase in TE has caused low levels of IR in some areas. The positive slope in the chart till Dec 2023 indicates the fund had a good run. The fund did manage to beat the benchmark in certain periods. A drop in the IR from 2023 indicates the management of the fund deviated from its benchmark. As of June 2023, IR is around -1.7090.
Portfolio analysis
Stock style chart
Morningstar’s stock style chart shows the ‘style’ of the stocks in the portfolio in terms of size and value/growth style. The centroid shows the weighted average while the zone circle shows how varied the stock styles are.
.

The growth-oriented fund has a wide range of investments across its category. Diversification is made in large-cap and mid-cap stocks. Larger weightage is given to large-cap blended stocks. The fund closely tracks the category but diversifies significantly.
Factor profile chart
Morningstar’s factor profile shows the historical style analysis of the stocks in the portfolio in terms of size, value/growth style, and other key factors. The blue circle shows the fund relative to the black dot for the category average.

The growth fund has shown a historical average in yield, but capital appreciation is the one to be largely noted. A high historical average is seen in momentum and the fund currently is below the category average. The quality too, is below the category average. The fund has a large-mid cap size.
Prepared by Sai Mahesh, August 2023
You must be logged in to post a comment.