INF174KA1HV3
Overall analysis
1-yr rolling excess returns of the fund is sustained between maximum and upper quartile (green) line. Fund’s snail trail chart assesses that it has been in the top left quadrant proceeding with positive excess returns by taking negative risk. TE of this fund is declined on a month-on-month basis & has a decent information ratio.
Performance analysis
Rolling returns – 1 year rolling excess returns
Snail trail – 1 year rolling excess risk/return
Tracking error – 1 year rolling tracking error
Information ratio – 1 year rolling information ratio
Rolling returns in quartiles
The rolling return chart shows excess 1Y-year rolling return in context of peer return quartiles. The blue line’s time above the third green median line indicates the fund’s better than median performance.
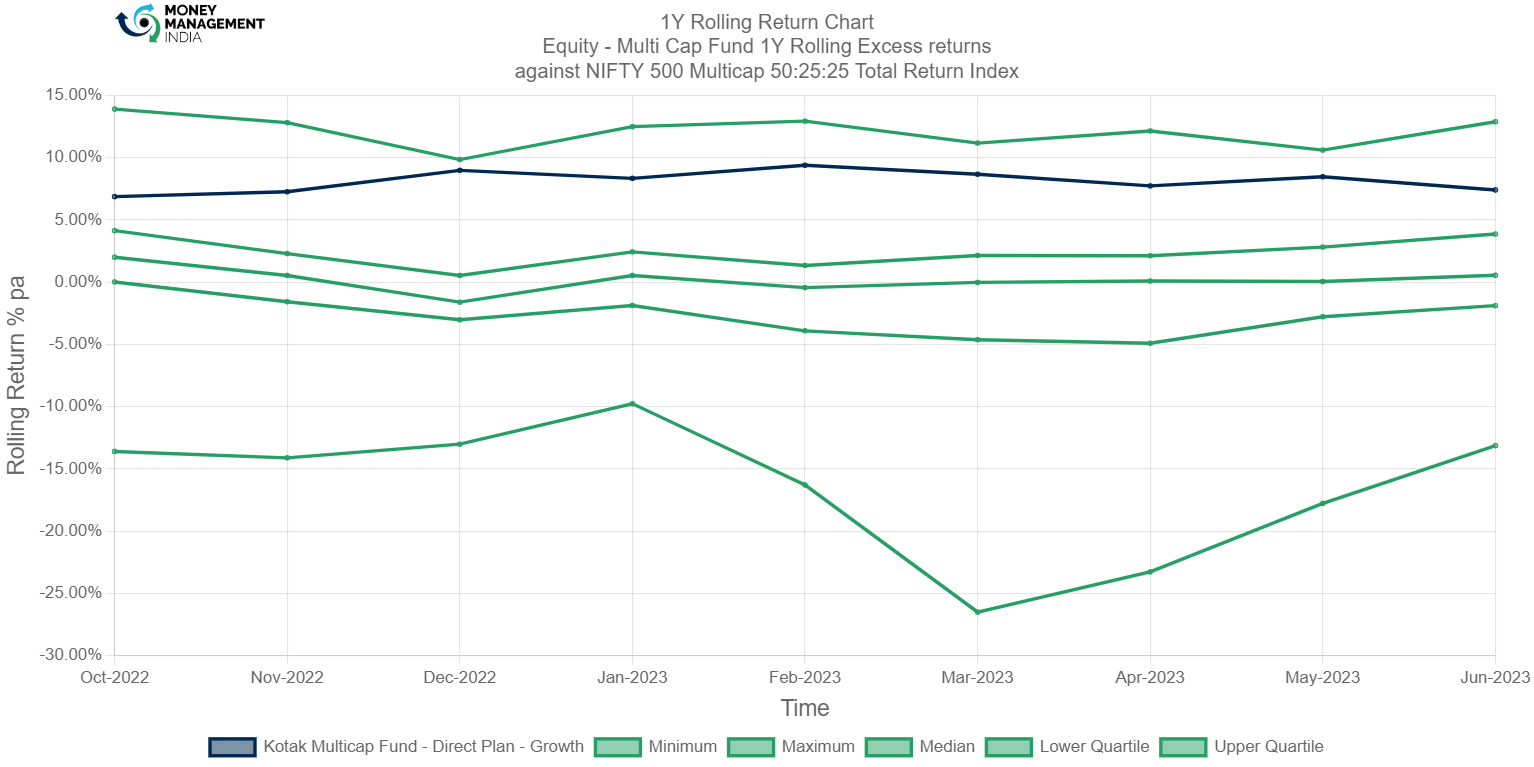
The 1 year rolling excess returns chart shows that the fund lies between upper quartile and maximum (green) line, in October 2022 it generated the returns of 6.8%, approaching the highest returns of 9.4% on February 2023 against benchmark. Overall, the fund has the excess returns compared to its peers
Currently the 1 year rolling returns stood at 7.4% as of June 2023.
Rolling risk/return (Snail-trail)
The rolling risk/return chart shows excess 1-year annualized returns relative to the index. The top left quadrant would indicate higher returns with lower volatility than index.

Started with positive risk of 0.05% and positive 1 year rolling excess return of 6.87% in top right quadrant & further the indicator moved to top left quadrant of negative risk and positive returns, so the fund took negative risk and generated positive returns; highest of 9.39% returns considering the negative risk of
-0.26% against its benchmark.
Tracking error
The tracking error chart shows how the fund ‘tracks’ against the index. The higher the TE, the more active the fund’s return has been, with the 1-3% range considered to be low TE, 3-6% range considered to be moderately active and anything higher than 6% is high TE. Funds with TE of less than 2% can be considered to be closet indexers.
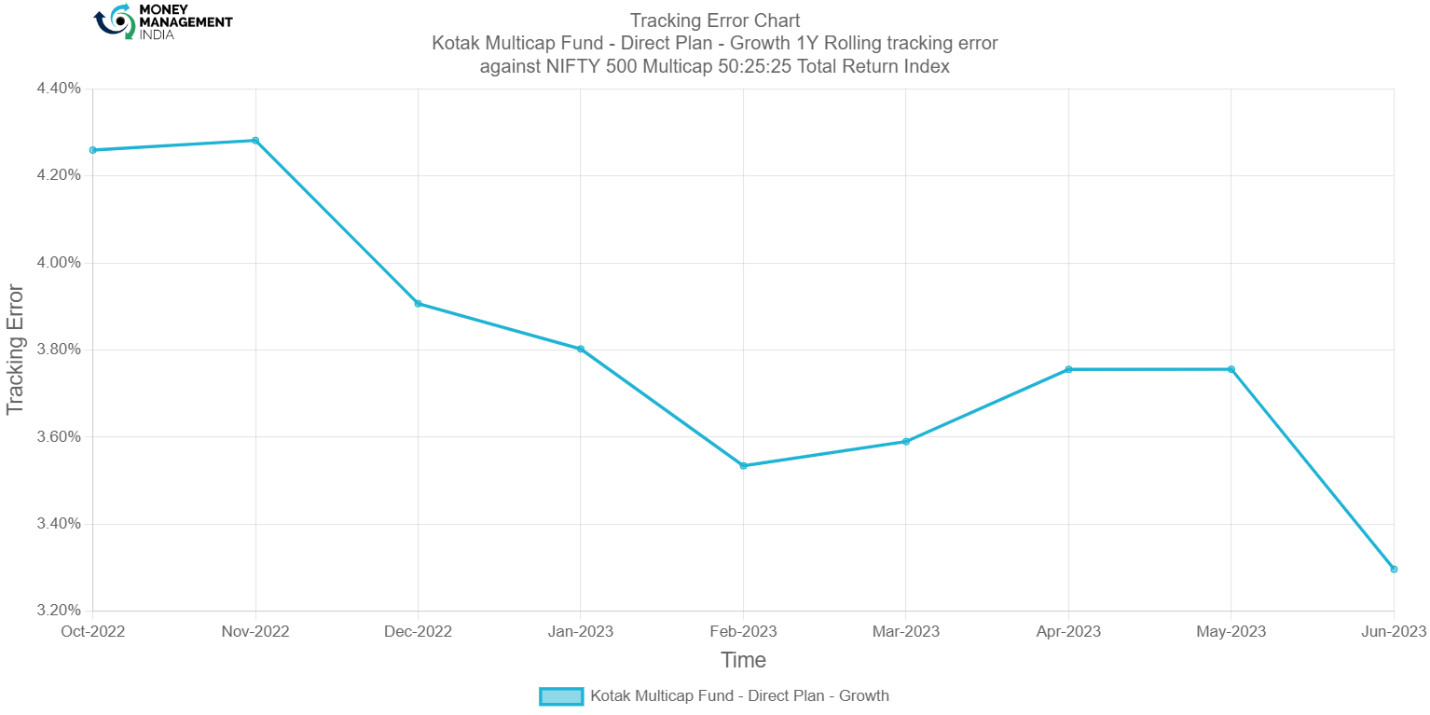
Tracking error chart shows that the fund’s overall TE is declining month-on-month, started with a moderate 1 year rolling tracking error of 4.2%, and stood at 3.2% in the recent past month of June 2023. Concluding that the fund is moderately active against its benchmark index.
Information ratio
The information ratio is a measure of ‘risk-adjusted return’ as it’s the excess return per unit of excess volatility. Active funds should have IR of higher than 1, ideally higher than 1.3 at least to indicate skill.

The 1 year rolling Information ratio chart has a couple of swings, beginning with the IR of 1.6- a quite decent IR to indicate skill and generating risk adjusted returns. This fund had the peak level IR of 2.6 & current IR Is 2.2.
Portfolio analysis
Stock style chart
Morningstar’s stock style chart shows the ‘style’ of the stocks in the portfolio in terms of size and value/growth style. The centroid shows the weighted average while the zone circle shows how varied the stock styles are.

The centroid indicator of this fund lies at the top middle & right corner of the box- which states that; the portfolio of this fund has more large cap stocks of blended as well as growth category. Ownership zone indicator has a broader ring as compared to its peers; it says that the fund has picks around all the caps (small, mid & large) with all the 3 categories (value, blended & Growth) stocks, but has less involvement in small cap stocks in comparison with mid & large cap stocks. While other multi-cap funds indicated by the yellow (ring)- indicates that its category has channelised its funds only into mid, large- growth & blended types of stocks.
Factor profile chart
Morningstar’s factor profile shows the historical style analysis of the stocks in the portfolio in terms of size, value/growth style and other key factors. The blue circle shows the fund relative to the black dot for the category average.
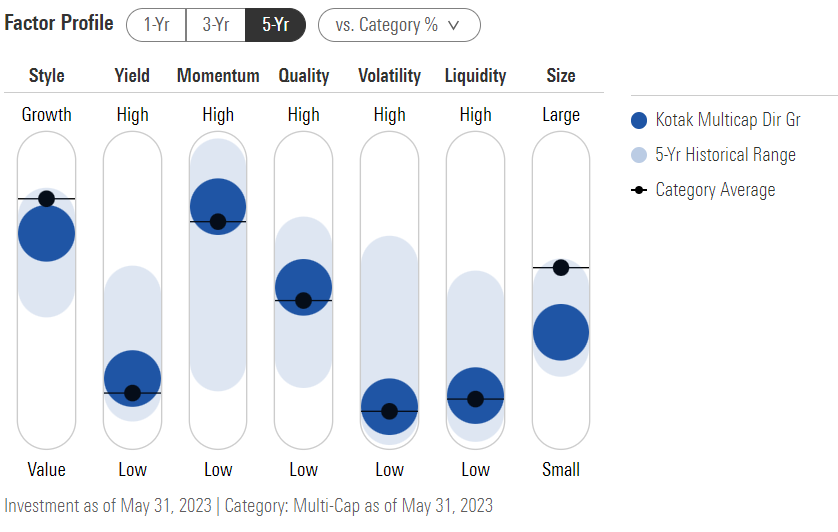
Morningstar’s factor profile chart concludes that yield is as low as its category average, while volatility & liquidity is low & according to the 5 years historical range it has been decreased till date. Momentum of the securities held & traded is quite good & high- similar to its category average. Overall quality of the stock picks is average & indicator stands between high & low. Therefore the portfolio stocks are interchanging to growth stocks throughout the 5 years historical range. Size indicator states; it is small as compared to its category.
Prepared by – Hemanth Reddy, August 2023
You must be logged in to post a comment.