INF846K013E0
Overall analysis
1-yr rolling excess returns is quite decent according to a new fund existing from 17 months as it has surpassed the upper quartile, fund is moderately active according to TE, overall, it has IR less than 1 – it is not an ideally active fund.
Performance analysis
Rolling returns –1 year rolling excess returns
Snail trail – 1 years rolling excess risk/return
Tracking error – 1 year rolling tracking error
Information ratio – 1 year rolling information ratio
Rolling returns in quartiles
The rolling return chart shows excess 1Y-year rolling return in context of peer return quartiles. The blue line’s time above the third green median line indicates the fund’s better than median performance.
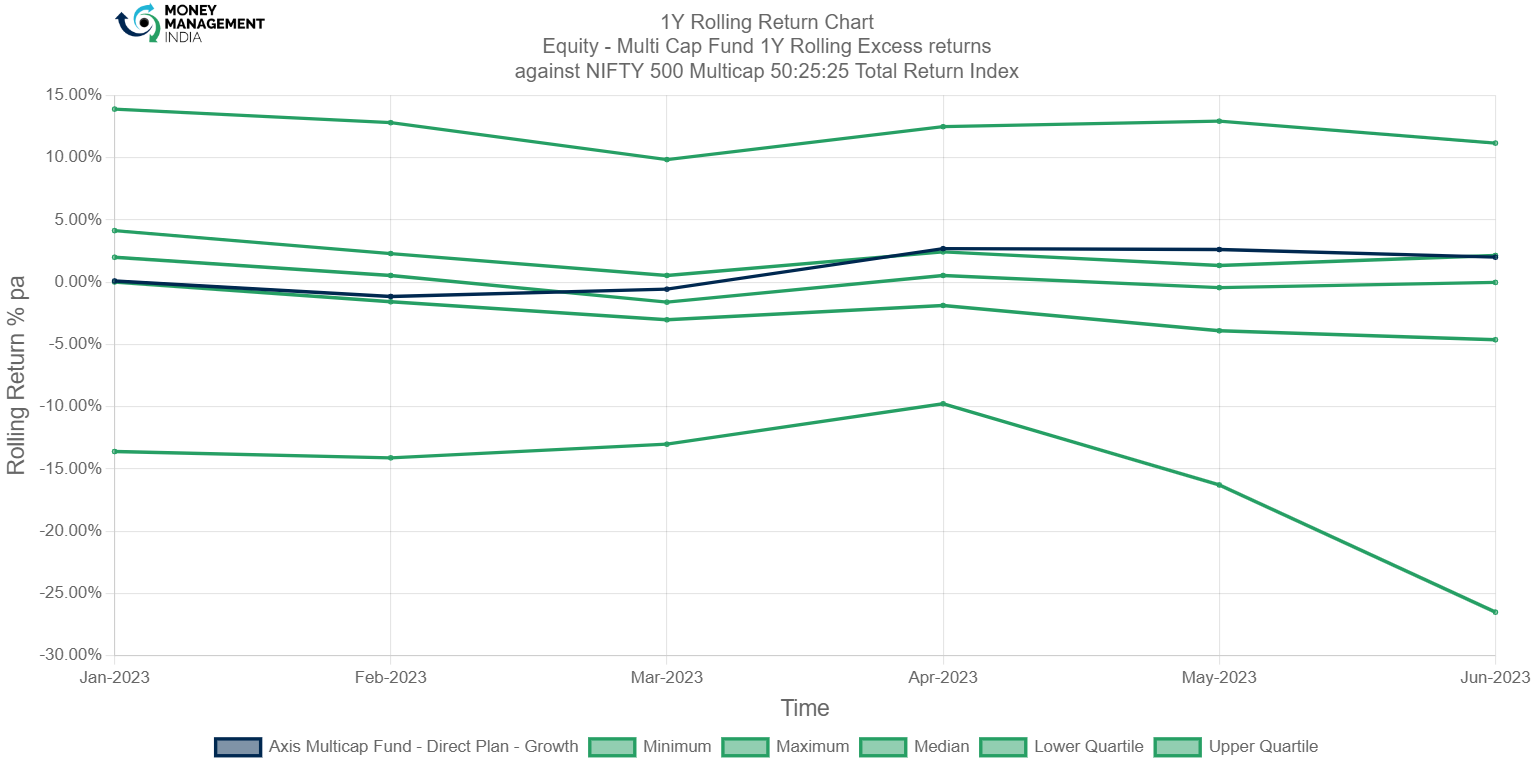
The fund was equal to lower quartile on January-2023 & has crossed the upper quartile in the month of April 2023, till May 2023 it was outperforming upper quartile by 0.14%-It touched the highest return of 2.69%, then after in June 2023 it slumps below the upper quartile.
Rolling risk/return (Snail-trail)
The rolling risk/return chart shows excess 1-year annualized returns relative to the index. The top left quadrant would indicate higher returns with lower volatility than index.
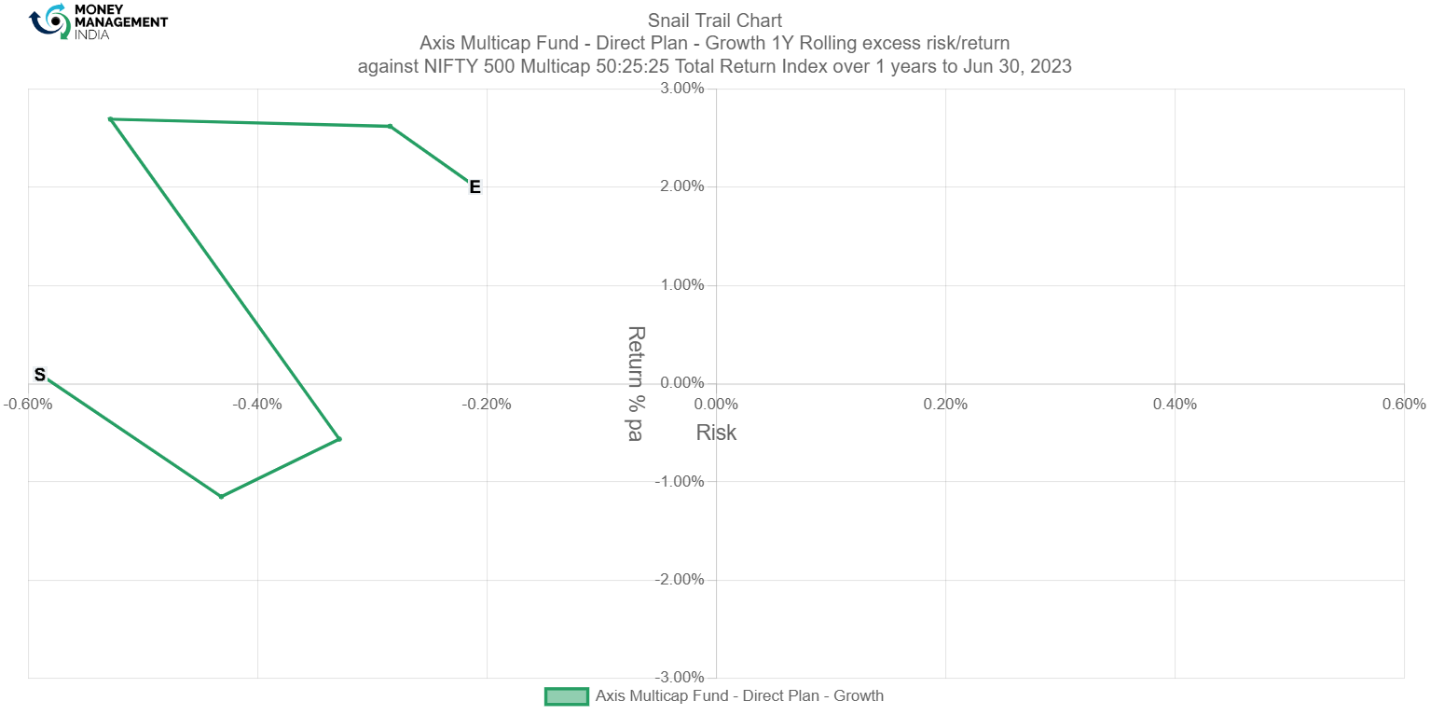
The snail trail chart shows that the fund had negative risk of -0.59% & 1 year rolling return of 0.09% on January 2023 & recently in the month of June 2023 it has negative risk of -0.21% and 1 year rolling return of 2.00% – this shows that the fund is growing steadily.
Tracking error
The tracking error chart shows how the fund ‘tracks’ against the index. The higher the TE, the more active the fund’s return has been, with the 1-3% range considered to be low TE, 3-6% range considered to be moderately active and anything higher than 6% is high TE. Funds with TE of less than 2% can be considered to be closet indexers.

The fund was highly active in January 2023 with the TE of 6.10%, from then it is declining till date. Currently the TE stands at 3.92% which means it is moderately active.
Information ratio
The information ratio is a measure of ‘risk-adjusted return’ as it’s the excess return per unit of excess volatility. Active funds should have IR of higher than 1, ideally higher than 1.3 at least to indicate skill.

Information ratio of this fund is negative during January, February & March, further in April it rose to 0.66, currently standing at 0.51 which is not ideal for an active fund.
Portfolio analysis
Stock style chart
Morningstar’s stock style chart shows the ‘style’ of the stocks in the portfolio in terms of size and value/growth style. The centroid shows the weighted average while the zone circle shows how varied the stock styles are

The centroid in Morningstar’s stock style chart of this fund shows that; the stocks in the portfolio belong to large cap-growth stocks; ownership zone is diversified around all the cap’s, whereas its peers have holdings around mid & large cap-growth as well as blended stocks.
Factor profile chart
Morningstar’s factor profile shows the historical style analysis of the stocks in the portfolio in terms of size, value/growth style and other key factors. The blue circle shows the fund relative to the black dot for the category average.

Factor profile indicator shows that the fund has growth stocks stuffed in its portfolio, whereas its peers’ average holding also has growth stocks in their portfolio bucket. Stock picks have great momentum;according to 5 years historical range- portfolio momentum was wide. Yield, volatility & liquidity are low. Category average indicator- which represents peers, is also around the funds indicator. Size indicator is pointing towards small.
Prepared by – Hemanth Reddy, August 2023
You must be logged in to post a comment.