ISIN INF00XX01AQ6
Overall analysis
1-yr rolling excess returns of the fund shows that it has given better returns than some of it’s peers. The TE and IR of the fund has been up to the benchmark which indicates that it was being actively managed.
Performance analysis
Rolling returns in quartiles
The rolling return chart shows excess 1-year annualised returns in context of peer return quartiles. The blue line’s time above the third green median line indicates the fund’s better than median performance.
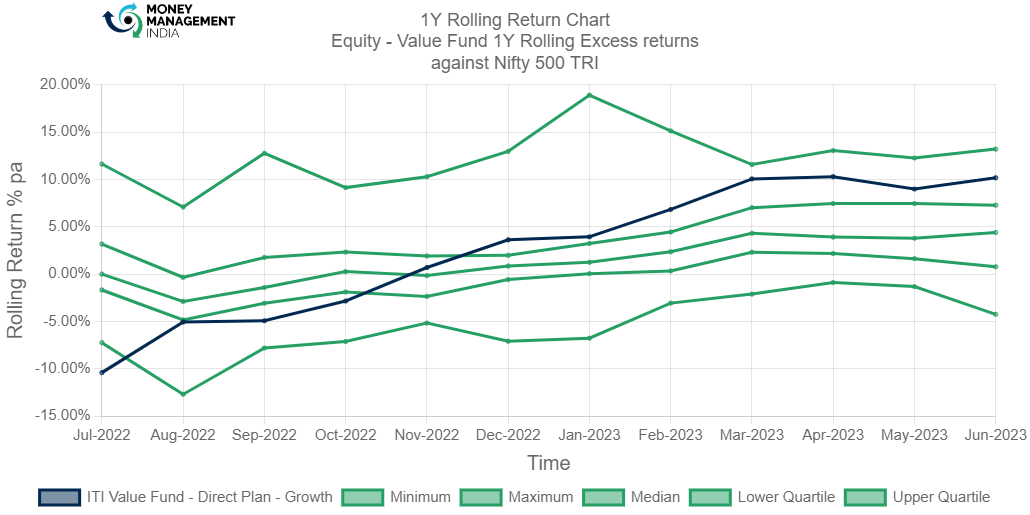
The 3Y rolling return chart shows that the fund has a rocky start in the beginning with -10.4% returns. Since Nov 2022 the fund has been generating positive returns and it also managed to outperform the benchmark with highest being 10.2% returns in Apr 2023.
Rolling risk/return (Snail-trail)
The rolling risk/return chart shows excess 1-year annualised returns relative to the index. The top left quadrant would indicate higher returns with lower volatility than index.
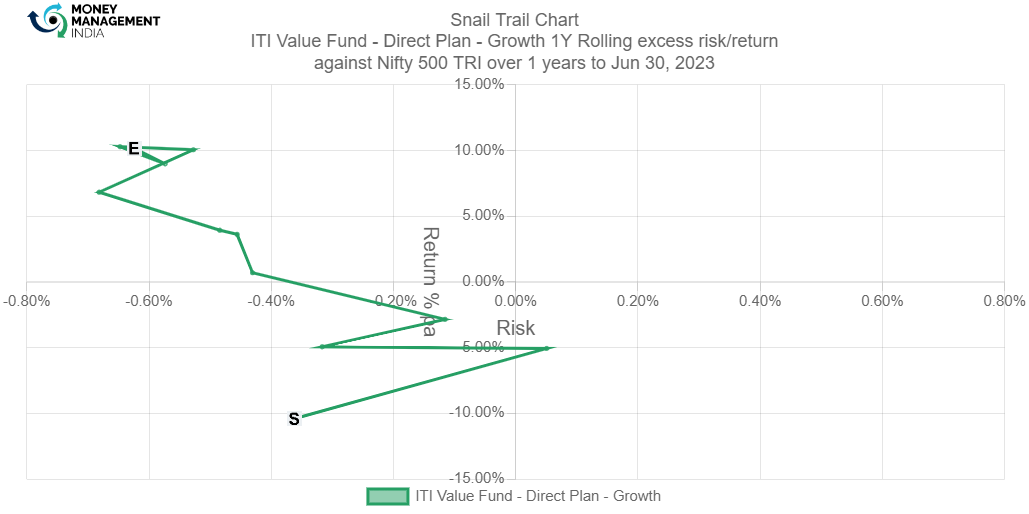
The snail trail chart of the fund rolling excess risk/return shows that the fund started with low returns and high volatility, being in the bottom left quadrant. Although the fund moved to the top left quadrant in Nov 2022, achieving high returns and low volatility index.
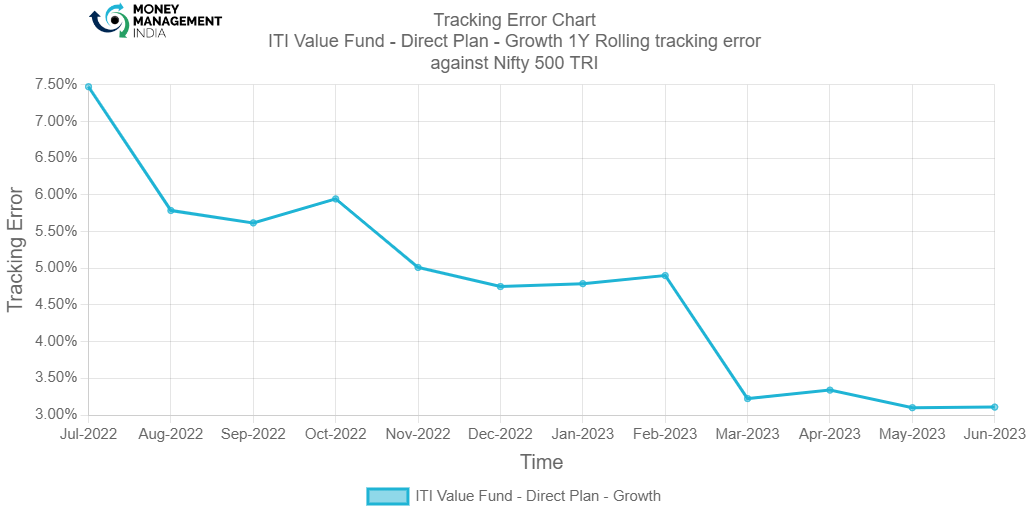
Tracking error
The tracking error chart shows how the fund ‘tracks’ against the index. The higher the TE, the more active the fund’s return has been, with the 2-4% range considered to be barely active, 4-6% range considered to be reasonably active and anything higher attributed to concentrated/focused funds. Funds with TE of less than 2% can be considered to be closet indexers.
Information ratio
The information ratio is a measure of ‘risk-adjusted return’ as it’s the excess return per unit of excess volatility. Active funds should have IR of higher than 1, ideally higher than 1.3 at least to indicate skill.
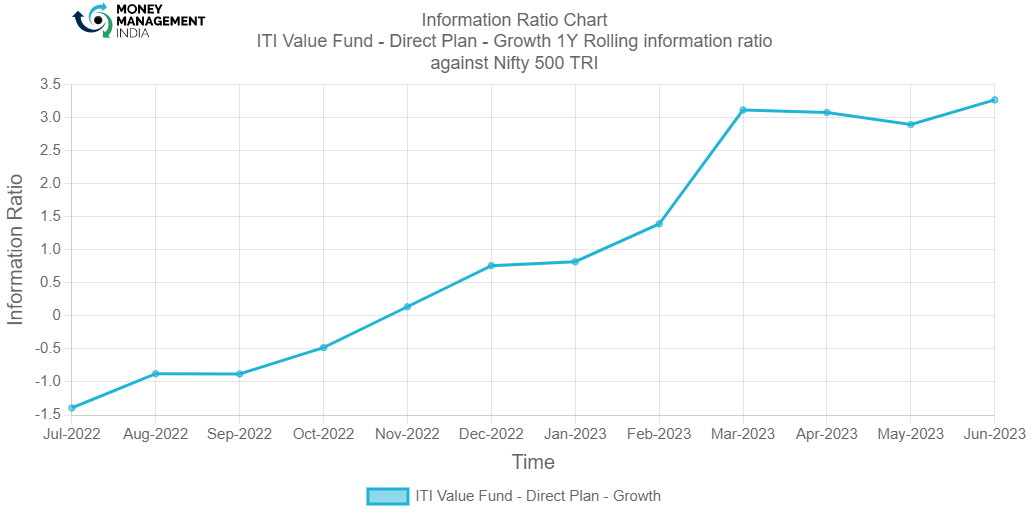
The decrease in TE has resulted in the increase in IR of the fund. The fund has shown an impressive inclined slope from Dec 2022 the highest IR was 3.1% in Mar 2023.
Portfolio analysis
Stock style chart
Morningstar’s stock style chart shows the ‘style’ of the stocks in the portfolio in terms of size and value/growth style. The centroid shows the weighted average while the zone circle shows how varied the stock styles are.
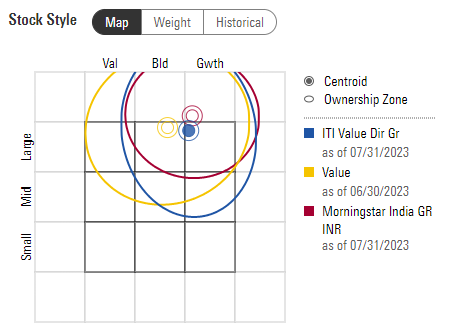
The stock style chart of the fund shows that the fund is slightly different from the category average. The centroid of the fund is in the large-growth section. The ownership zone of the fund shows that the investments are mainly in large and mid cap stocks and it is growth or blend oriented. Although some value stocks can be seen in the ownership zone.
Factor profile chart
Morningstar’s factor profile shows the historical style analysis of the stocks in the portfolio in terms of size, value/growth style and other key factors. The blue circle shows the fund relative to the black dot for the category average.
chart
(comment on chart)
Prepared by – Ayushi Shervegar, August 2023
You must be logged in to post a comment.