ISIN INF209K01WQ7
Overall analysis
The 3Y rolling returns chart shows that the fund has beaten the benchmark but the long term performance is not good, as it generated negative returns for some years in between. The TE and IR of the fund is more aligned with the benchmark. The fund has given good returns but it has not been consistent due to high volatility within the category.
Performance analysis
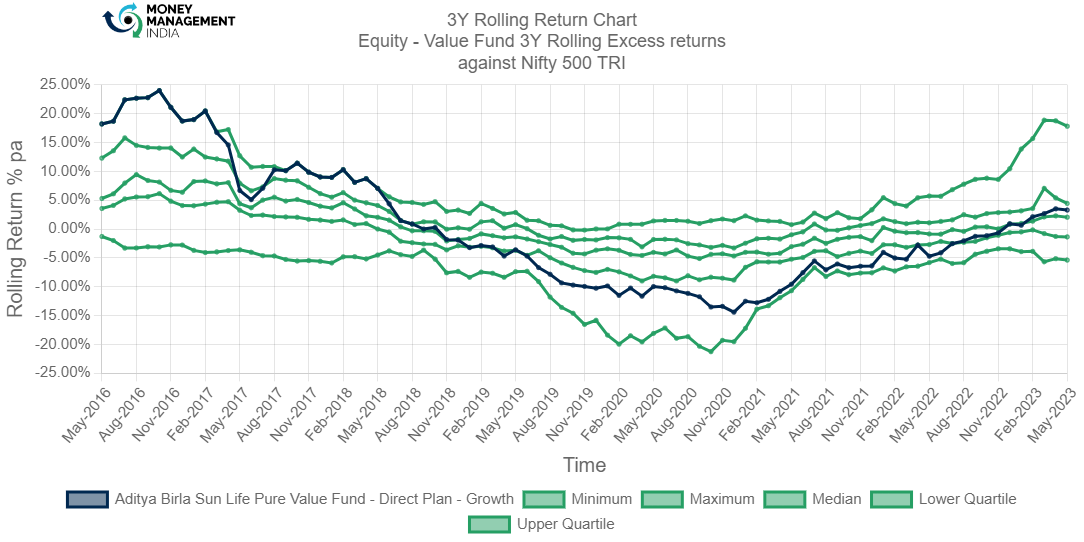
Rolling returns in quartiles
The rolling return chart shows excess 3-year annualised returns in context of peer return quartiles. The blue line’s time above the third green median line indicates the fund’s better than median performance.
.
The 3Y rolling return of the chart shows that the fund had an impressive performance in the start with 24.01% highest return against the benchmark. The fund started to underperform from mid 2018 and can be seen generating negative returns for a longer period with -14.41% in Dec 2020. The fund is currently at 3.50% by the end of June 2023.
Rolling risk/return (Snail-trail)
The rolling risk/return chart shows excess 3-year annualised returns relative to the index. The top left quadrant would indicate higher returns with lower volatility than index.
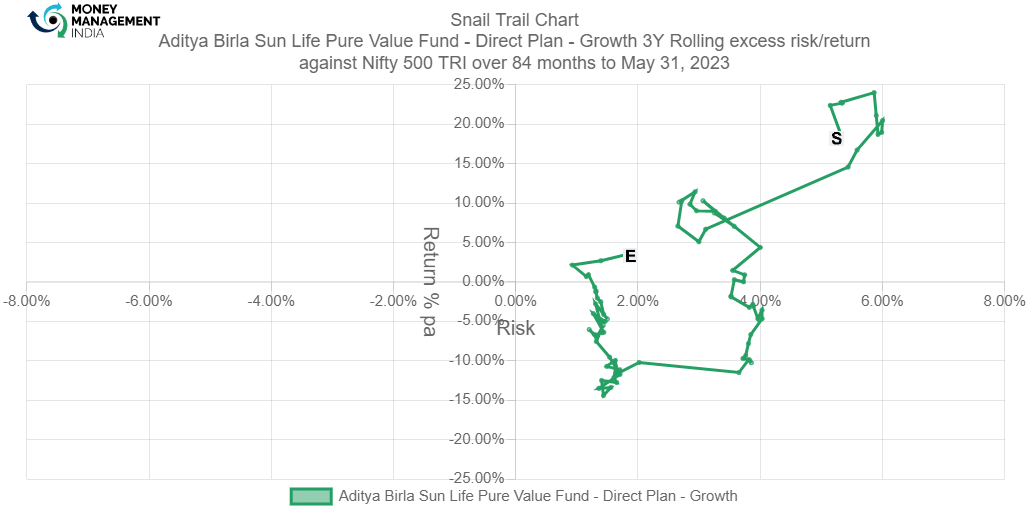
This fund has shown impressive 3-year excess returns, touching 24% per annum and a significant time around the 5-15% pa, whilst lower than index volatility of -14%pa around Dec 2020 indicates it had high risk and low returns. However, the excess return went up from -14% to 2% towards the end of Mar 2023.
Tracking error
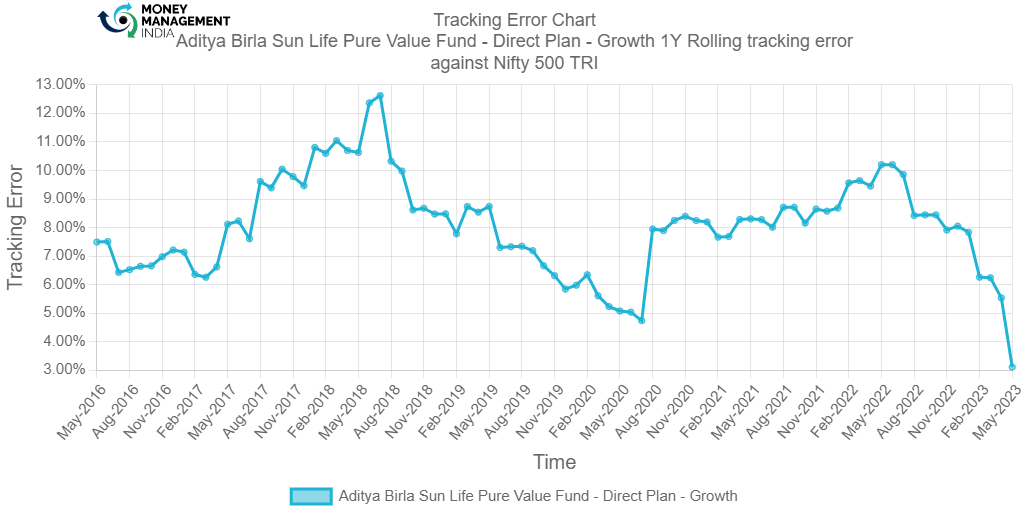
The tracking error chart shows how the fund ‘tracks’ against the index. The higher the TE, the more active the fund’s return has been, with the 2-4% range considered to be barely active, 4-6% range considered to be reasonably active and anything higher attributed to concentrated/focused funds. Funds with TE of less than 2% can be considered to be closet indexers.
Information ratio
The information ratio is a measure of ‘risk-adjusted return’ as it’s the excess return per unit of excess volatility. Active funds should have IR of higher than 1, ideally higher than 1.3 at least to indicate skill.

The Information ratio of the fund was less than 1% in the start and it was below 0% from June 2018 to 2020. The IR was again fluctuating between 1-0% and is currently at 2.9%.
Portfolio analysis
Stock style chart
Morningstar’s stock style chart shows the ‘style’ of the stocks in the portfolio in terms of size and value/growth style. The centroid shows the weighted average while the zone circle shows how varied the stock styles are.
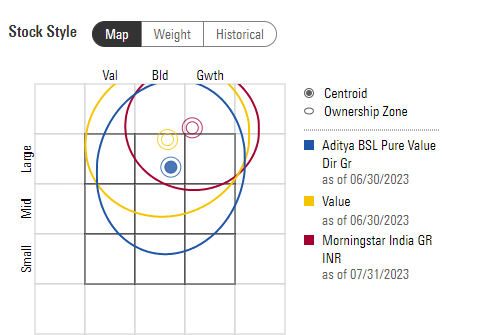
The ownership zone is quite broader as it covers the large-mid section, along with some in the small stocks section. The centroid is in the large blend section, some value stocks can be seen in the ownership zone.
Factor profile chart
Morningstar’s factor profile shows the historical style analysis of the stocks in the portfolio in terms of size, value/growth style and other key factors. The blue circle shows the fund relative to the black dot for the category average.

The factor profile chart shows the style of the fund is closer to the blend section and slightly above the category average. It is generating a lower yield and is also quite below the average as we know a lower exposure to the yield factor indicates a lower yield for investors. The assets have grown significantly above the category average with a wide historical range. The quality and the liquidity of the fund is closer to being low. The market capitalization is below the category average as it lies between the mid-small cap section.
Prepared by – Ayushi Shervegar, August 2023
You must be logged in to post a comment.