ISIN INF192K01BT3
Overall analysis
The TE of the fund hasn’t met the benchmark and the IR of the fund hasn’t been 1%. The 3Y excess rolling returns shows that the fund did generate positive returns.The fund has not given the maximum excess return in comparison to its peers.
Performance analysis
Rolling returns in quartiles
The rolling return chart shows excess 3-year annualised returns in context of peer return quartiles. The blue line’s time above the third green median line indicates the fund’s better than median performance.
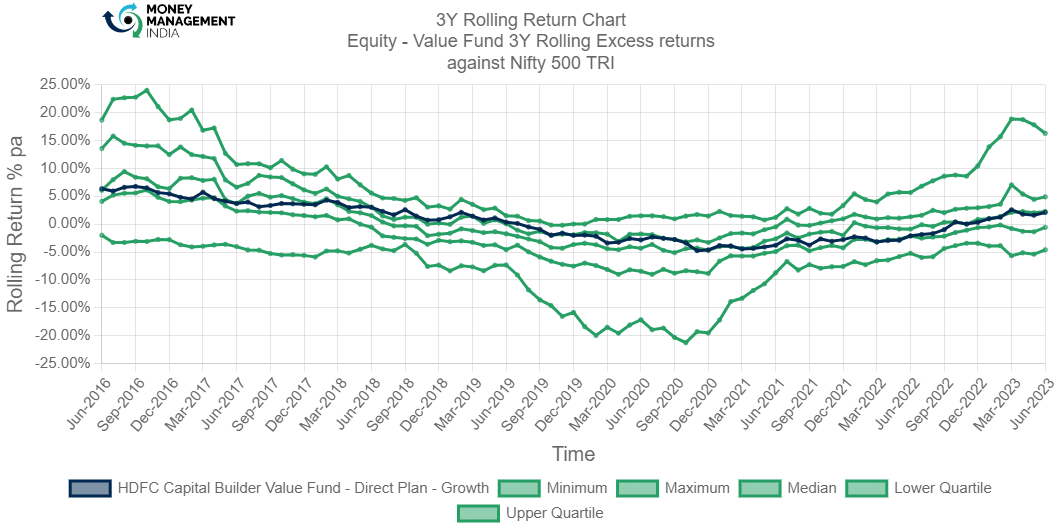
The rolling excess return of the fund shows the average return of the fund was around 5-6% as the blue line is between upper quartile and lower quartile. The fund has crossed median green line in 2018 but the return is below the median line since Mar 2021 with return of – 4%. Currently the return is at 2% trying to cross the median.
Rolling risk/return (Snail-trail)
The rolling risk/return chart shows excess 3-year annualised returns relative to the index. The top left quadrant would indicate higher returns with lower volatility than index.
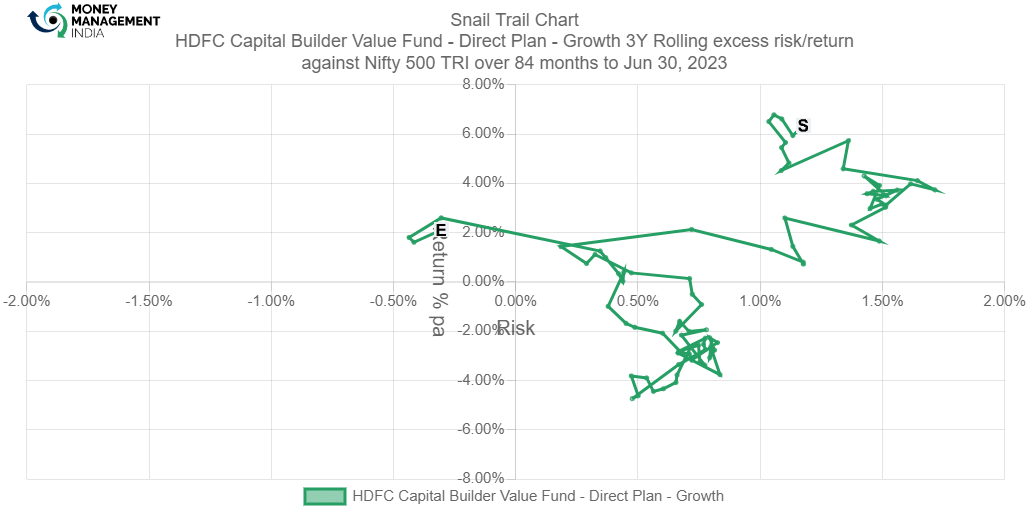
The snail trail chart of the fund shows that the fund was doing good in the start by generating positive return but from Jul 2019 to Sep 2022, the fund has generated negative return between -1 to – 4% at the risk level 0 to 0.5%. From Nov 2022 onwards the fund was between 0 to 2% with risk level -0.3 to -0.4%.
Tracking error
The tracking error chart shows how the fund ‘tracks’ against the index. The higher the TE, the more active the fund’s return has been, with the 2-4% range considered to be barely active, 4-6% range considered to be reasonably active and anything higher attributed to concentrated/focused funds. Funds with TE of less than 2% can be considered to be closet indexers.
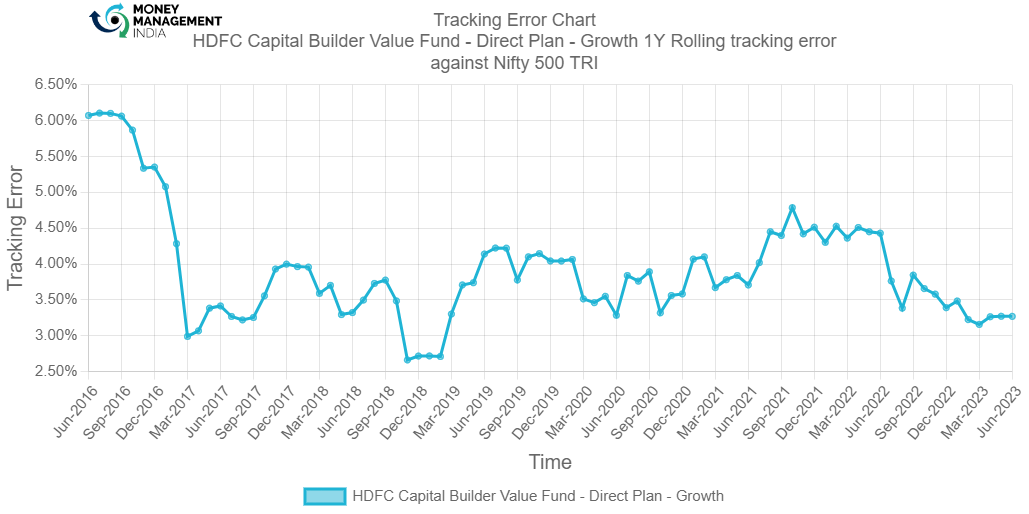
TE of the fund is relatively high at 6% in the start which later declined to 3%. The fund was at 2.6% TE in Sep 2018 which gradually inclined further to 4%. Overall the fund has been performing between 3-5% and is currently at 3.6% which indicates that the fund is reasonably active.
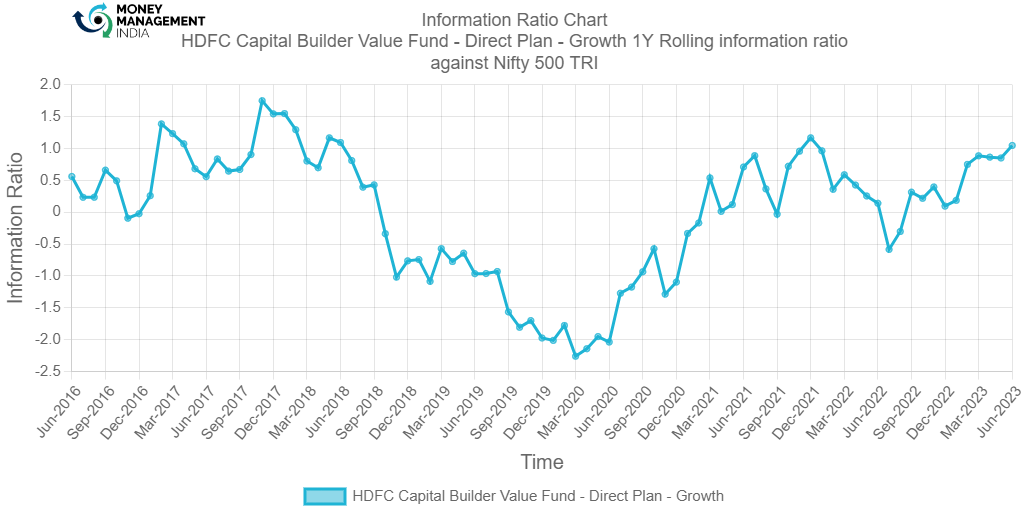
Information ratio
The information ratio is a measure of ‘risk-adjusted return’ as it’s the excess return per unit of excess volatility. Active funds should have IR of higher than 1, ideally higher than 1.3 at least to indicate skill.
Portfolio analysis
Stock style chart
Morningstar’s stock style chart shows the ‘style’ of the stocks in the portfolio in terms of size and value/growth style. The centroid shows the weighted average while the zone circle shows how varied the stock styles are.
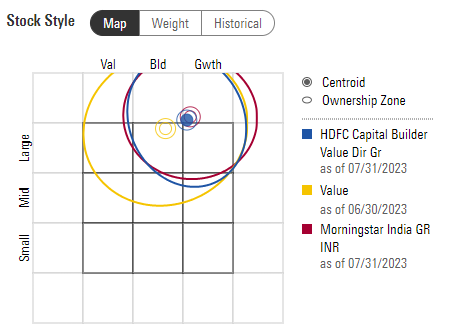
The stock style shows that the fund is performing as the category average. The centroid of the fund can be seen in the large-growth section. The onwership zone shows that the fund has some invesments in mid-cap stocks as well. Value stocks investments can be seen.
Factor profile chart
Morningstar’s factor profile shows the historical style analysis of the stocks in the portfolio in terms of size, value/growth style and other key factors. The blue circle shows the fund relative to the black dot for the category average.
chart
(comment on chart)
Prepared by – Ayushi Shervegar, August 2023
You must be logged in to post a comment.