ISIN INF740KA1PP3
Overall analysis
As the fund’s rolling excess can be seen not meeting up the benchmark, the benchmark’s performance is better than the fund, as of now. TE and IR of the fund is also quite below the margin making it lower compared to its peers.
Performance analysis
Rolling returns in quartiles
The rolling return chart shows excess 1-year annualised returns in context of peer return quartiles. The blue line’s time above the third green median line indicates the fund’s better than median performance.

The fund rolling return chart shows that the fund has been persistently negative and lies between the minimum, lower quartile and the median for most of the time as the lines are overlapping giving negative return until Jan 2023, the fund crossed the third median line with a positive return of 1.9% . It gave the highest return of 4.5% in Apr 2023 and later declined towards 0.5% by the end of May 2023.
Rolling risk/return (Snail-trail)
The rolling risk/return chart shows excess 1-year annualised returns relative to the index. The top left quadrant would indicate higher returns with lower volatility than index.
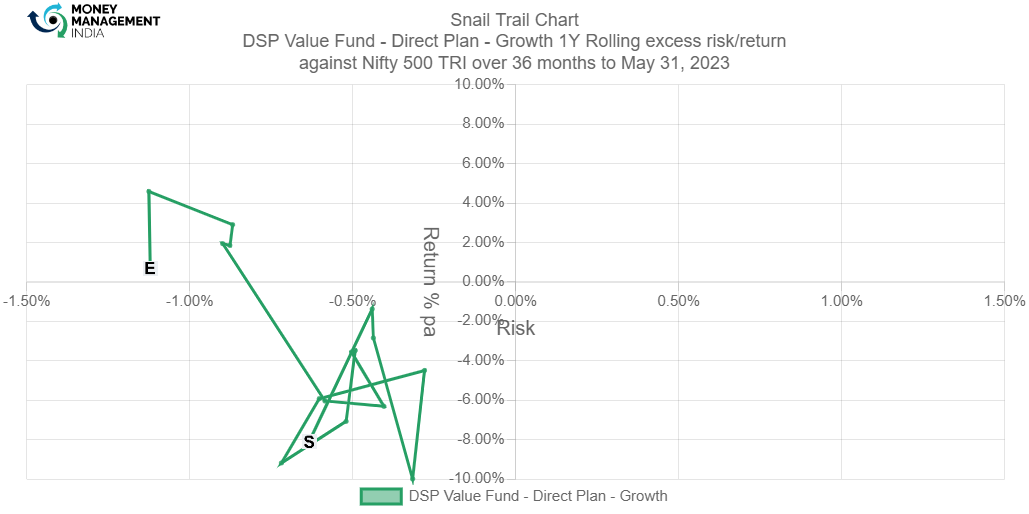
The snail trail chart of the fund is seen to be not good since the start. It has been generating negative returns. It touched -9.9% in April 2022 with the risk at -0.3% which was the lowest. The fund inclined towards a positive range between 1 – 4% between Jan 2023 to Apr 2023, further declined to 1% by the end of May 2023.
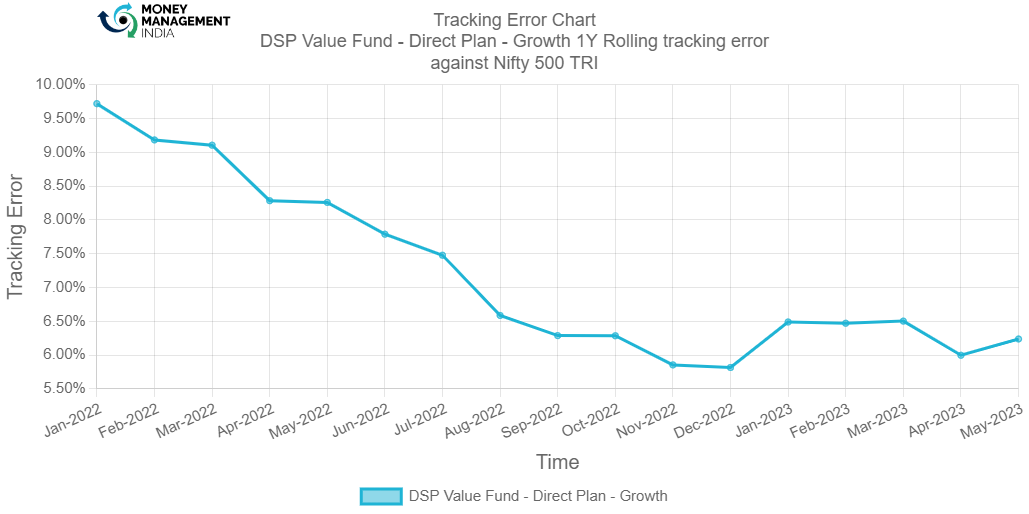
Tracking error
The tracking error chart shows how the fund ‘tracks’ against the index. The higher the TE, the more active the fund’s return has been, with the 2-4% range considered to be barely active, 4-6% range considered to be reasonably active and anything higher attributed to concentrated/focused funds. Funds with TE of less than 2% can be considered to be closet indexers.
Information ratio
The information ratio is a measure of ‘risk-adjusted return’ as it’s the excess return per unit of excess volatility. Active funds should have IR of higher than 1, ideally higher than 1.3 at least to indicate skill.
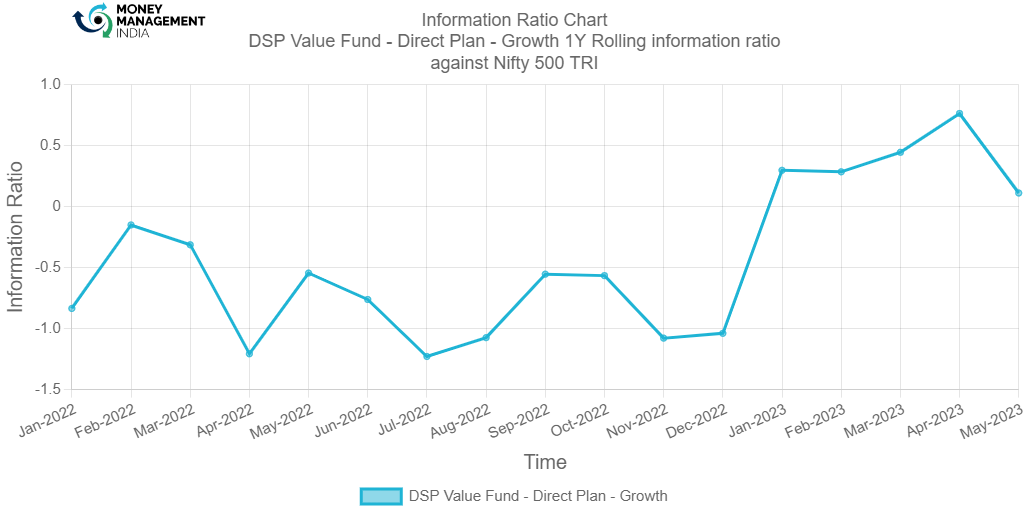
The Information ratio of the fund is less than 0 from the start till Jan 2023 the IR moved upward and crossed 0 and was between 0.2% to 0.7%. Although it has still not crossed 1 yet which indicates that the fund is not ideal to an active fund.
Portfolio analysis
Stock style chart
Morningstar’s stock style chart shows the ‘style’ of the stocks in the portfolio in terms of size and value/growth style. The centroid shows the weighted average while the zone circle shows how varied the stock styles are.
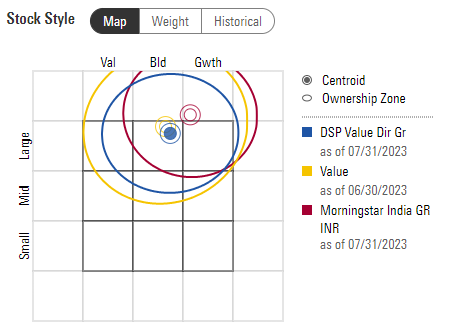
The stock style of the fund is performing as per the category average. The centroid can be seen in the large-blend section. The ownership zone shows that the fund has a large -growth section some stocks can be seen the large- value and mid cap stocks.
Factor profile chart
Morningstar’s factor profile shows the historical style analysis of the stocks in the portfolio in terms of size, value/growth style and other key factors. The blue circle shows the fund relative to the black dot for the category average.

The style of the fund is higher growth-oriented as the exposure is more than value exposure, above the category average. It is generating a lower yield and is also quite below the average as we know a lower exposure to the yield factor indicates a lower yield for investors. Assets have equally appreciated and depreciated in value as shown in momentum. The profitability of the fund is quite higher than its category average but the volatility and liquidity is closer to being low. The market capitalization of the fund is in the mid section.
Prepared by – Ayushi Shervegar, August 2023
You must be logged in to post a comment.