Performance analysis
Rolling returns in quartiles
The 3 year excess rolling returns are negative across the corporate bond. The blue line is mostly in the 2nd/3rd quartile.
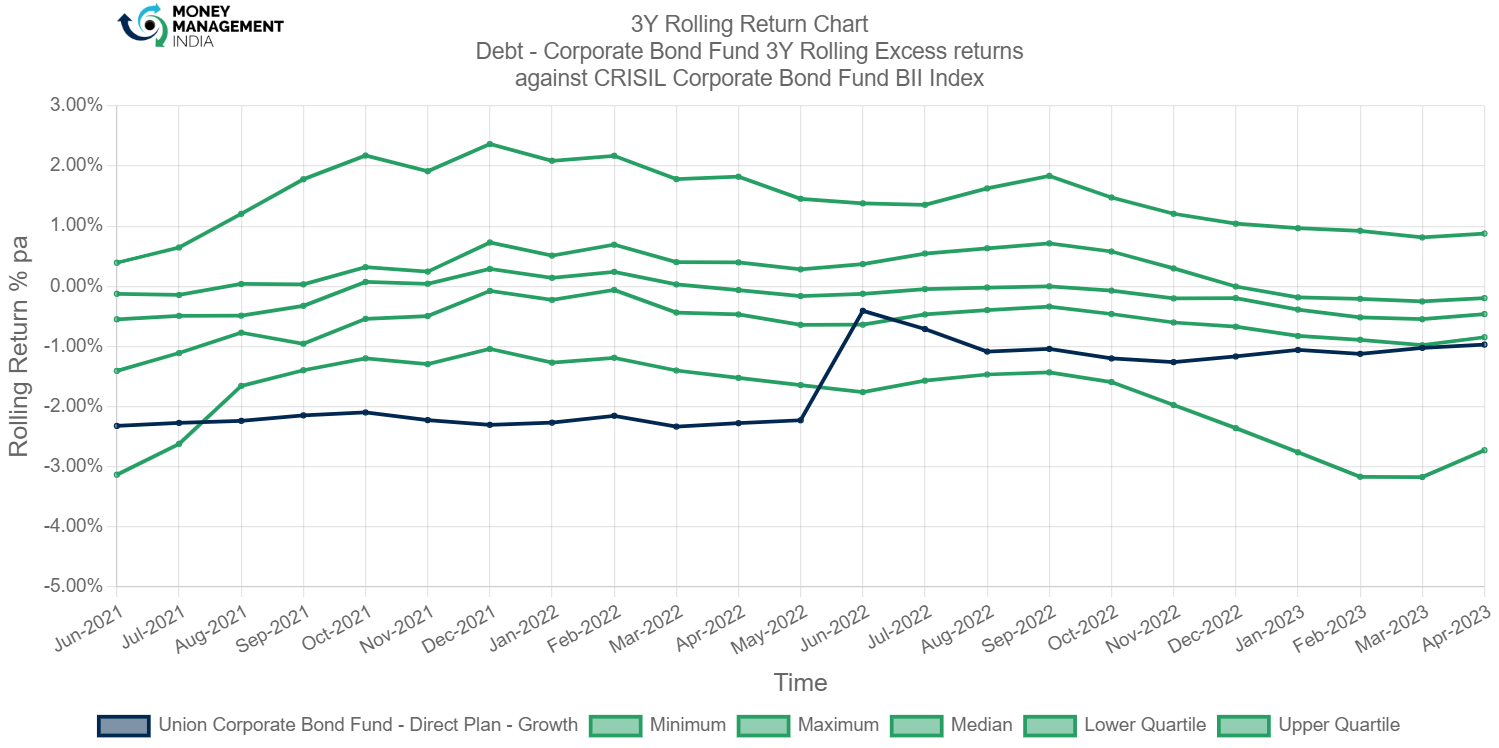
The rolling returns show that the fund was underperforming. Always the fund below the median line.
Rolling risk/return (Snail-trail)
The standard deviation on the 3 year excess returns range between -1% to 3%. overall there is high volatility in the fund.
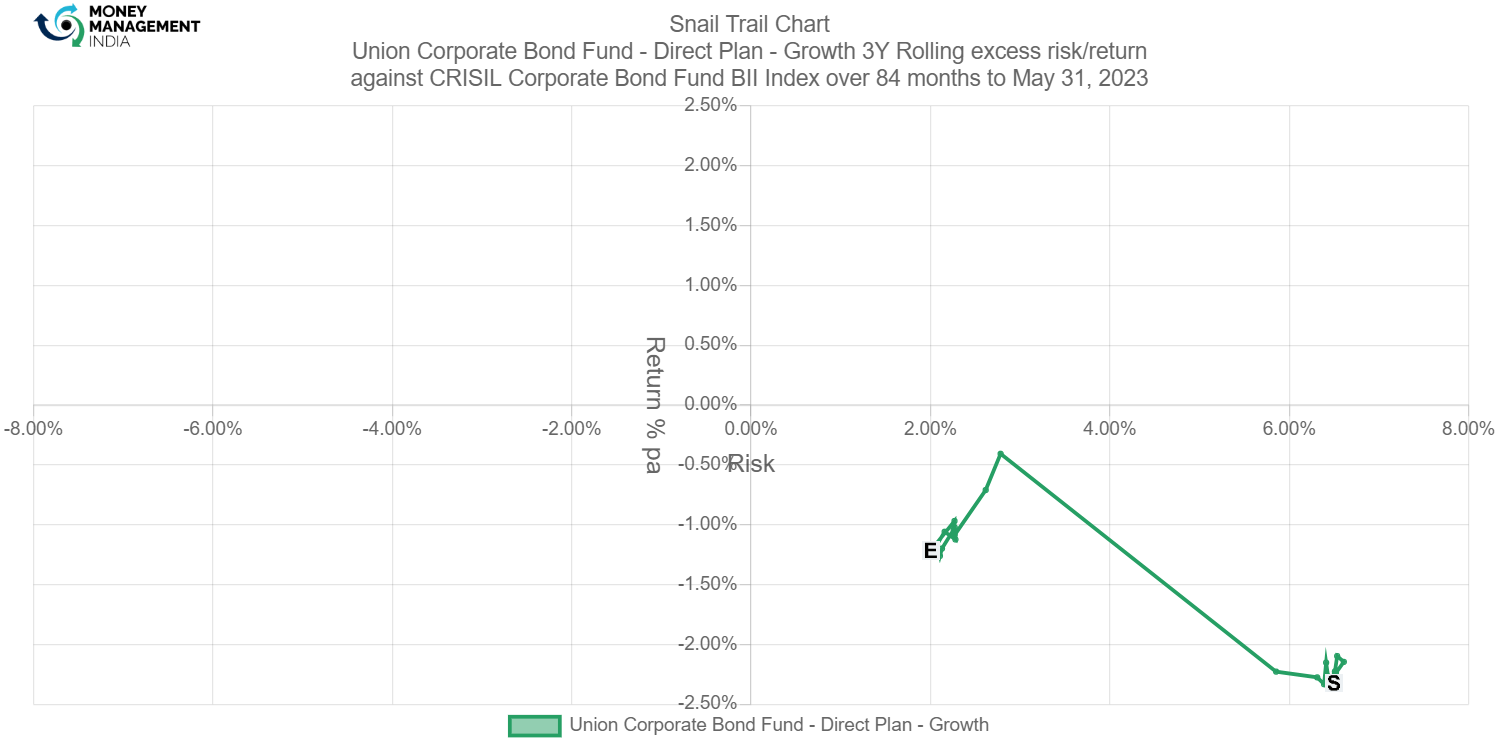
The snail trail depicts that at the start the fund generated negative returns and at a higher risk of about 0.7%. As of May 2023, the fund generated negative returns and a risk of 2%.
Tracking error
The tracking error ranges between 0 to 2

The TE was at 5.5% in the month of May 2020, then it drastically fell down to 1.5% in the next month. Later for the rest period it did not show any change in the TE. As of May 2023, the TE is at 0.5%.
Information ratio
The information ratio ranges between 0 to -3.5. The overall ratio has been mostly below 0.
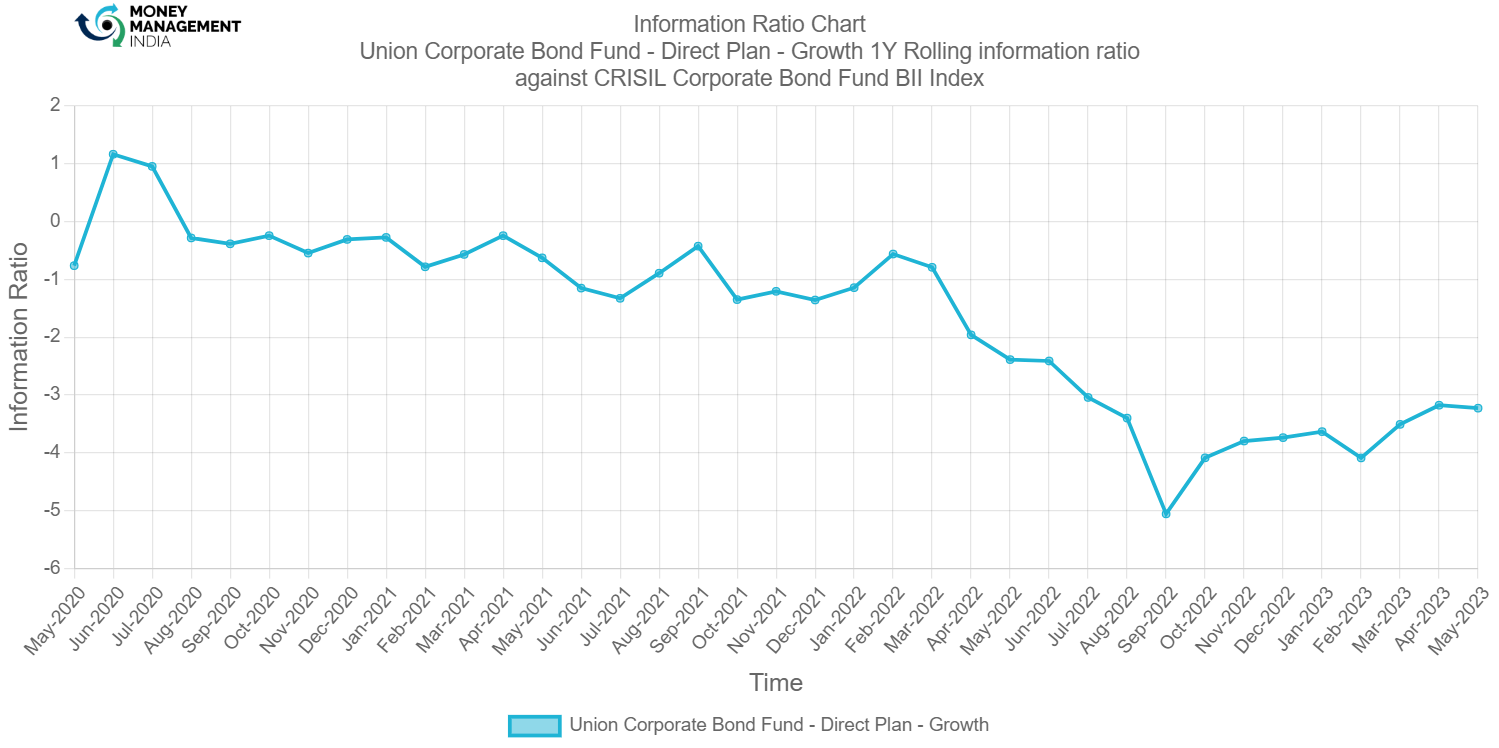
The IR was at its peak with around 1.1 in the month of June 2020.the IR is always negative from the month of Aug 2023. As of May 2023, the IR is at -3.1.
Prepared by – Ganesh Hulke
You must be logged in to post a comment.