INF903JA1DT7
Overall analysis
3-years rolling excess returns of the fund has declined by underperforming its benchmark as well as its peers. This fund’s TE is moderate, IR is negative; not generating risk adjusted returns. The fund gave negative returns against its benchmark during past recent months; 3 year rolling returns stood by underperforming its benchmark and peers by -9.5%.
Performance analysis
Rolling returns – 3 years rolling returns over 5 years
Snail trail – 3 years rolling excess risk/return over 5 years
Tracking error – 1yr rolling tracking error
Information ratio – 1yr rolling information ratio
Rolling returns in quartiles
The rolling return chart shows excess 1Y-year rolling return in context of peer return quartiles. The blue line’s time above the third green median line indicates the fund’s better than median performance.
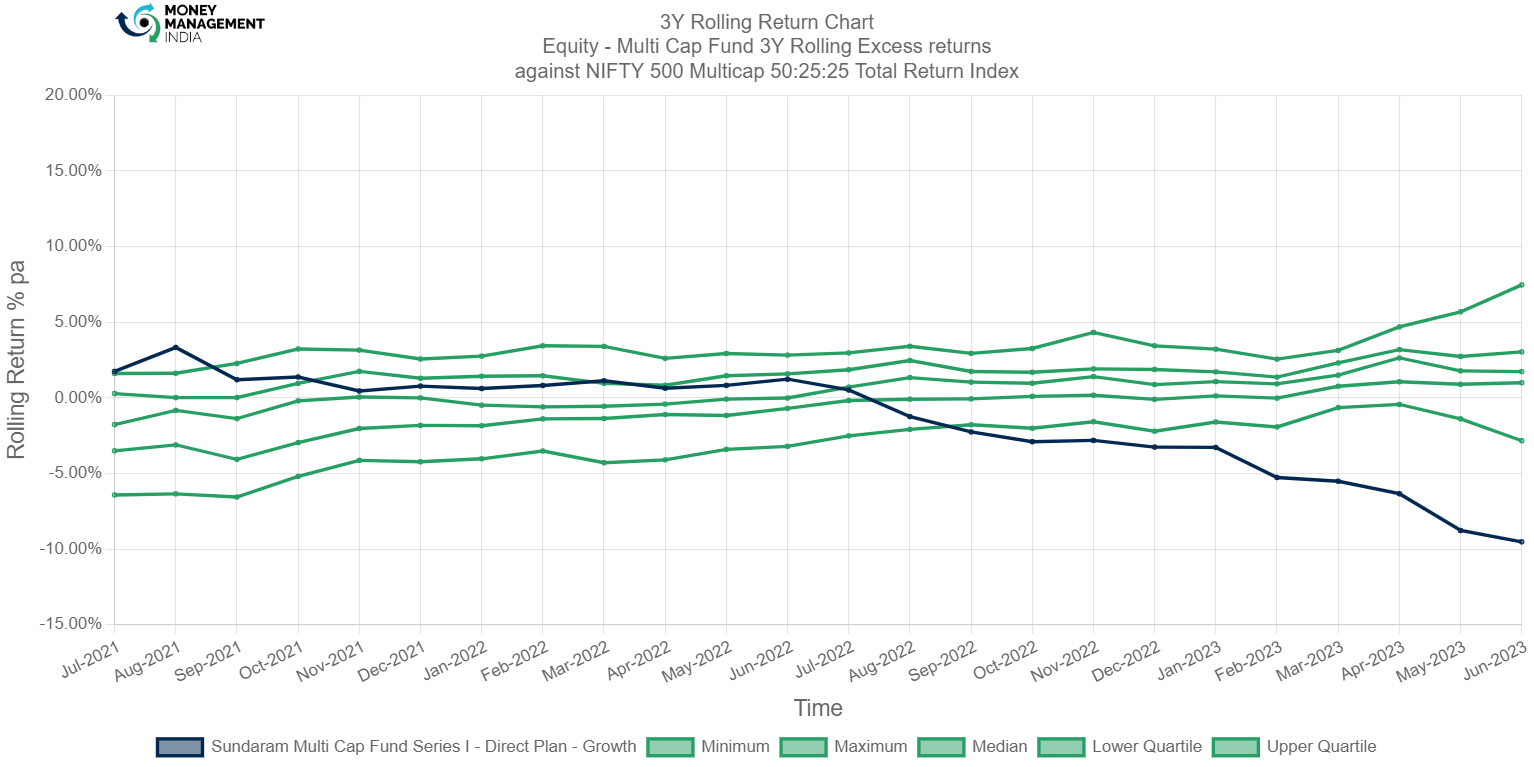
According to chart; the fund started by overperforming its benchmark with the highest excess return of 3.3% & further its excess returns started declining throughout the years, at its earliest stages it was above the maximum (green) line & then had downfall crossing down the (green) lines indicating maximum, upper quartile, median, lower quartile & minimum. Currently, as of June 2023 the fund’s 3 year rolling returns stood by underperforming its benchmark and peers at -9.5%.
Rolling risk/return (Snail-trail)
The rolling risk/return chart shows excess 1-year annualized returns relative to the index. The top left quadrant would indicate higher returns with lower volatility than index.
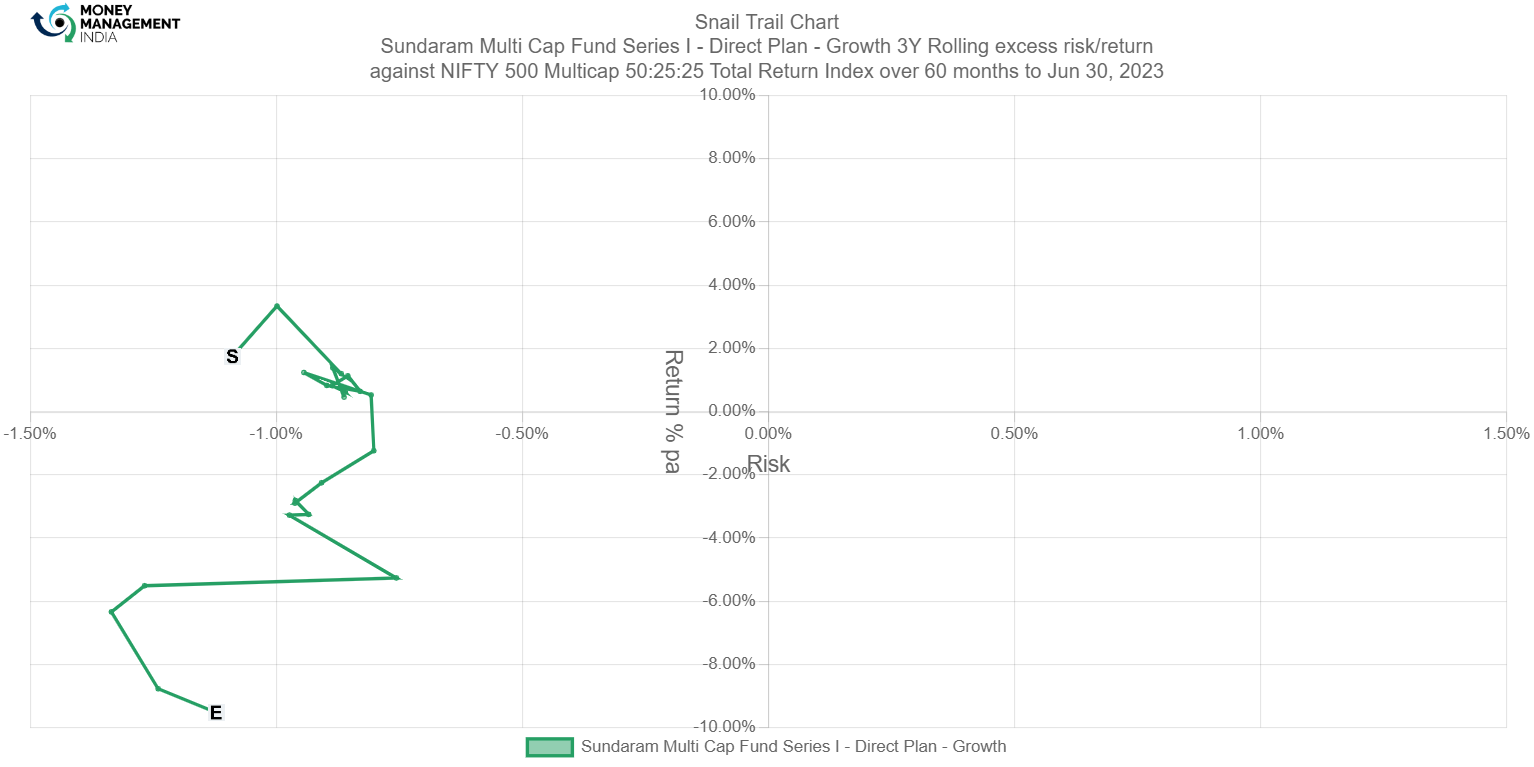
The snail trail chart shows that the fund performance has been great at the start point as we can see in the top left quadrant; which indicates taking risk in negative factor & generating excess (+ve) returns against its benchmark, later on it slumped towards bottom left quadrant which indicates taking least risk in negative factor and underperforming index. As shown in the chart the start point indicates that the fund generated 3Y rolling return of 1.7% excess than benchmark by taking the risk of -1% & currently it ended with negative 3Y rolling return of -9.5% by taking the risk of -1.1%
Tracking error
The tracking error chart shows how the fund ‘tracks’ against the index. The higher the TE, the more active the fund’s return has been, with the 1-3% range considered to be low TE, 3-6% range considered to be moderately active and anything higher than 6% is high TE. Funds with TE of less than 2% can be considered to be closet indexers.

1 year rolling tracking error had been moderate most of the time and highly active sometime. It has most of its traces around 2% to 6% (2% is considered to be closet indexers). Had the highest TE of 8.1%, as per data available in the chart; TE stands at 6.7% which means the fund is somewhere between moderately & highly active.
Information ratio
The information ratio is a measure of ‘risk-adjusted return’ as it’s the excess return per unit of excess volatility. Active funds should have IR of higher than 1, ideally higher than 1.3 at least to indicate skill.

Information ratio of this fund had a great dip of -9.7 in the month of May 2021, further it tried to recover, in May 2022 i.e., almost after 1 year it had a positive IR of 0.1. This fund has the highest IR of 3.5, currently as of June 2023 the funds IR is negative (-2.1).
Prepared by – Hemanth Reddy, August 2023
You must be logged in to post a comment.