ISIN
Overall analysis
3-yr rolling excess returns remains below minimum and has not given good performance and TE against benchmark have also not been good overall; The fund has not given the maximum excess return in comparison to its peers; and has made little to no progress over the past 1 year.
Performance analysis
Rolling returns – 3yr rolling excess returns over 7 years
Snail trail – 3y rolling excess over 7yrs
Tracking error – 1yr rolling over 7yrs
Information ratio – 1yr rolling over 7yrs
Rolling returns in quartiles
The rolling return chart shows excess 3-year annualised returns in context of peer return quartiles. The blue line’s time above the third green median line indicates the fund’s better than median performance.
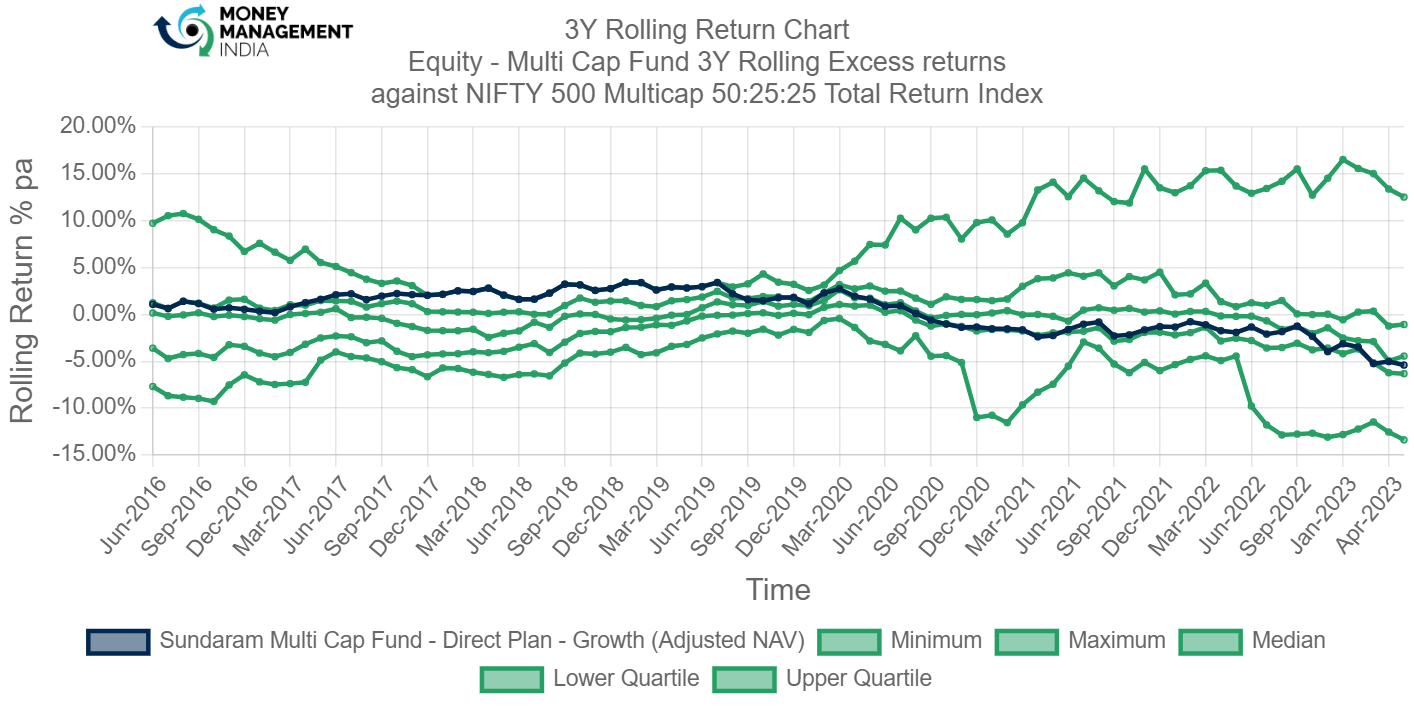
The funds rolling return chart shows that the fund is below the median, the maximum rolling return of a multi cap fund is 12.54 whereas this specific fund’s maximum rolling return is -5.4%% which is not ideal as compared to its peers. The Rolling Return Chart shows a poor performance.
The fund has been hovering around the median and the lower quartile range.
Rolling risk/return (Snail-trail)
The rolling risk/return chart shows excess 3-year annualised returns relative to the index. The top left quadrant would indicate higher returns with lower volatility than index.
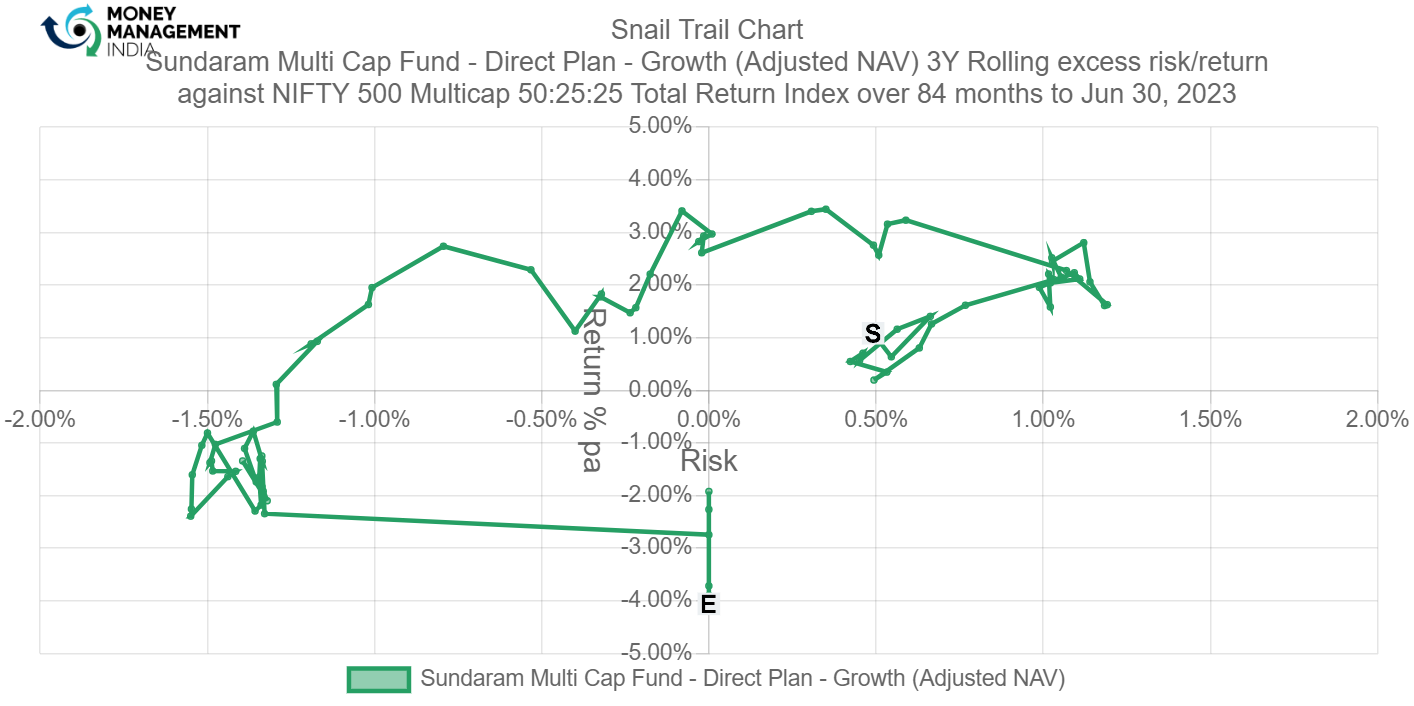
The snail trail chart is not great, but is in the harmless section of the chart. The fund has almost always given returns. The return is more than the risk taken.
Tracking error
The tracking error chart shows how the fund ‘tracks’ against the index. The higher the TE, the more active the fund’s return has been, with the 2-4% range considered to be barely active, 4-6% range considered to be reasonably active and anything higher attributed to concentrated/focused funds. Funds with TE of less than 2% can be considered to be closet indexers.
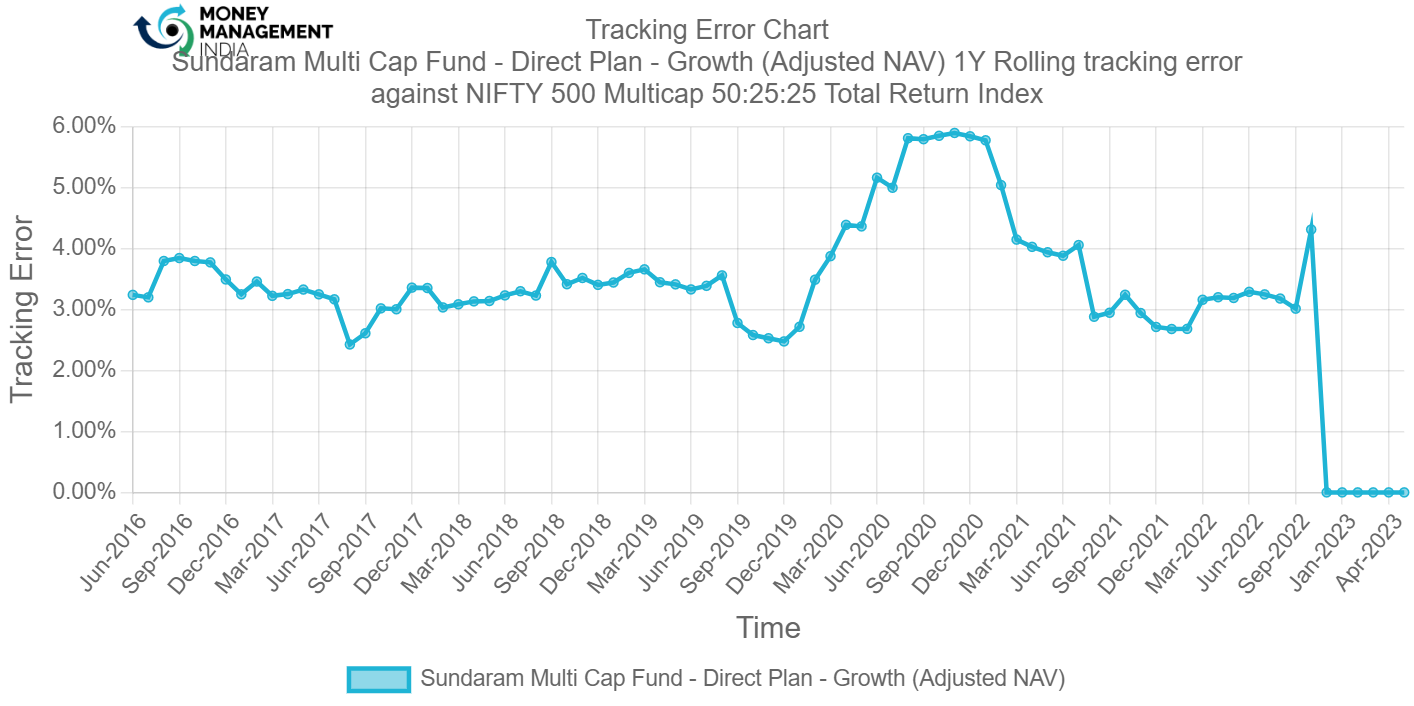
TE of the fund has been overall good, In 2016 it started above 3% and has reached a maximum of 6% and has dropped drastically to 0% which is clearly inactive.
Information ratio
The information ratio is a measure of ‘risk-adjusted return’ as it’s the excess return per unit of excess volatility. Active funds should have IR of higher than 1, ideally higher than 1.3 at least to indicate skill.

The information ratio of the fund shows a positive side but dropped in 2019 and is still negative which is not ideal.
Prepared by – Hemanth Reddy, August 2023
You must be logged in to post a comment.