ISIN INF200K01UJ5
Overall Analysis
The fund’s 3-year rolling returns and IR show that the fund did earn surprisingly good returns but in the long run, the fund performed moderately. In the short run, however, the fund outperformed the benchmark and achieved good returns. The active management allocated growth securities to the fund.
Performance Analysis
Rolling returns in quartiles
The rolling return chart shows excess 3-year annualized returns in the context of peer return quartiles. The blue line’s time above the third green median line indicates the fund’s better than the median performance of the benchmark.
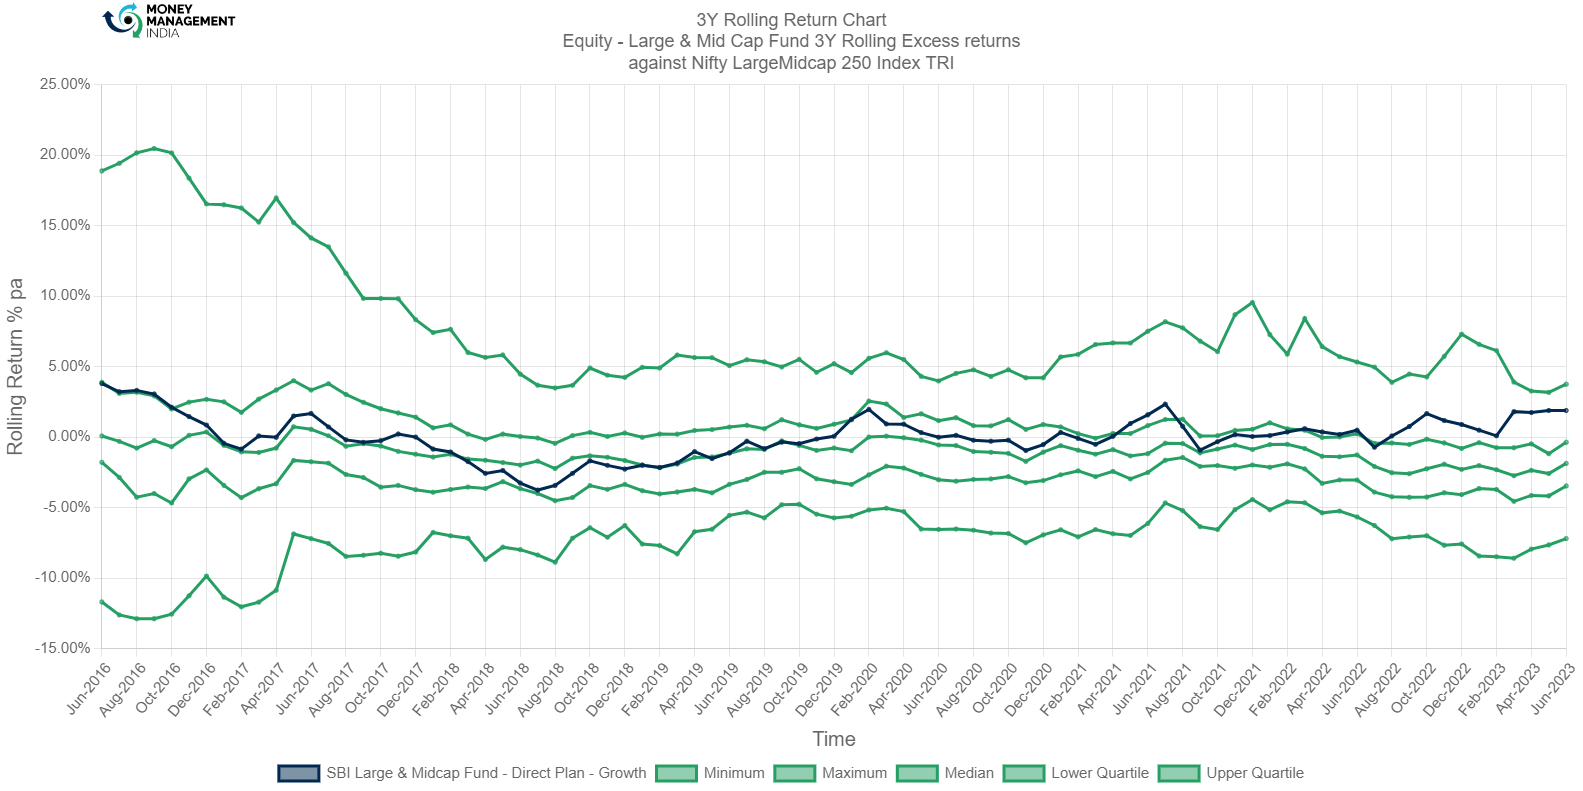
The 3-year rolling returns show that the fund actively tried to outperform the benchmark that is in the region of the negative return. Initially, the fund had a return of 3.82% which subsequently dropped to -3.75% by Jul 2018. The fund then outperformed the index in Nov 2019 with -0.13% returns. The funds return on Jun 2023 is 1.89%.
Rolling Risk/return (snail-trail)
The rolling risk/return chart shows excess 3-year annualized returns relative to the index. The top left quadrant would indicate higher returns with lower volatility than the index.
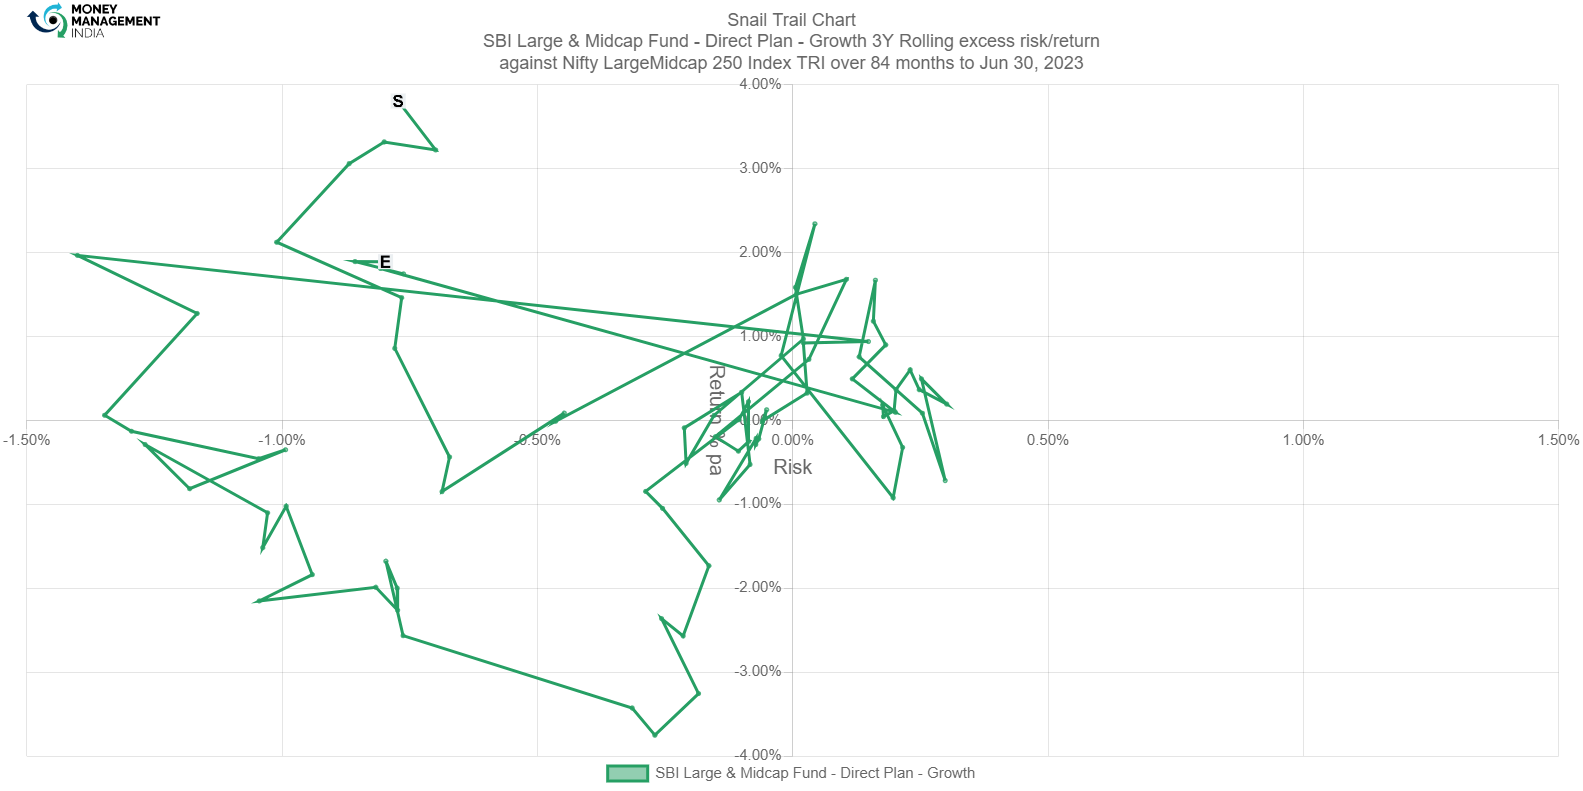
This fund outperformed the index several times. It started in the first quartile with minimal risk and spent a lot of time in the quartile of high risk. Still, the fund achieved good returns with minimally accepted levels of risk. The fund has been increasing its performance since late 2019 and has constantly achieved returns greater than the median.
Tracking Error
The tracking error chart shows how the fund ‘tracks’ against the index. The higher the TE, the more active the fund’s return has been, with the 2-4% range considered to be barely active, the 4-6% range considered to be reasonably active, and anything higher attributed to concentrated/focused funds. Funds with TE of less than 2% can be considered to be closet indexers.
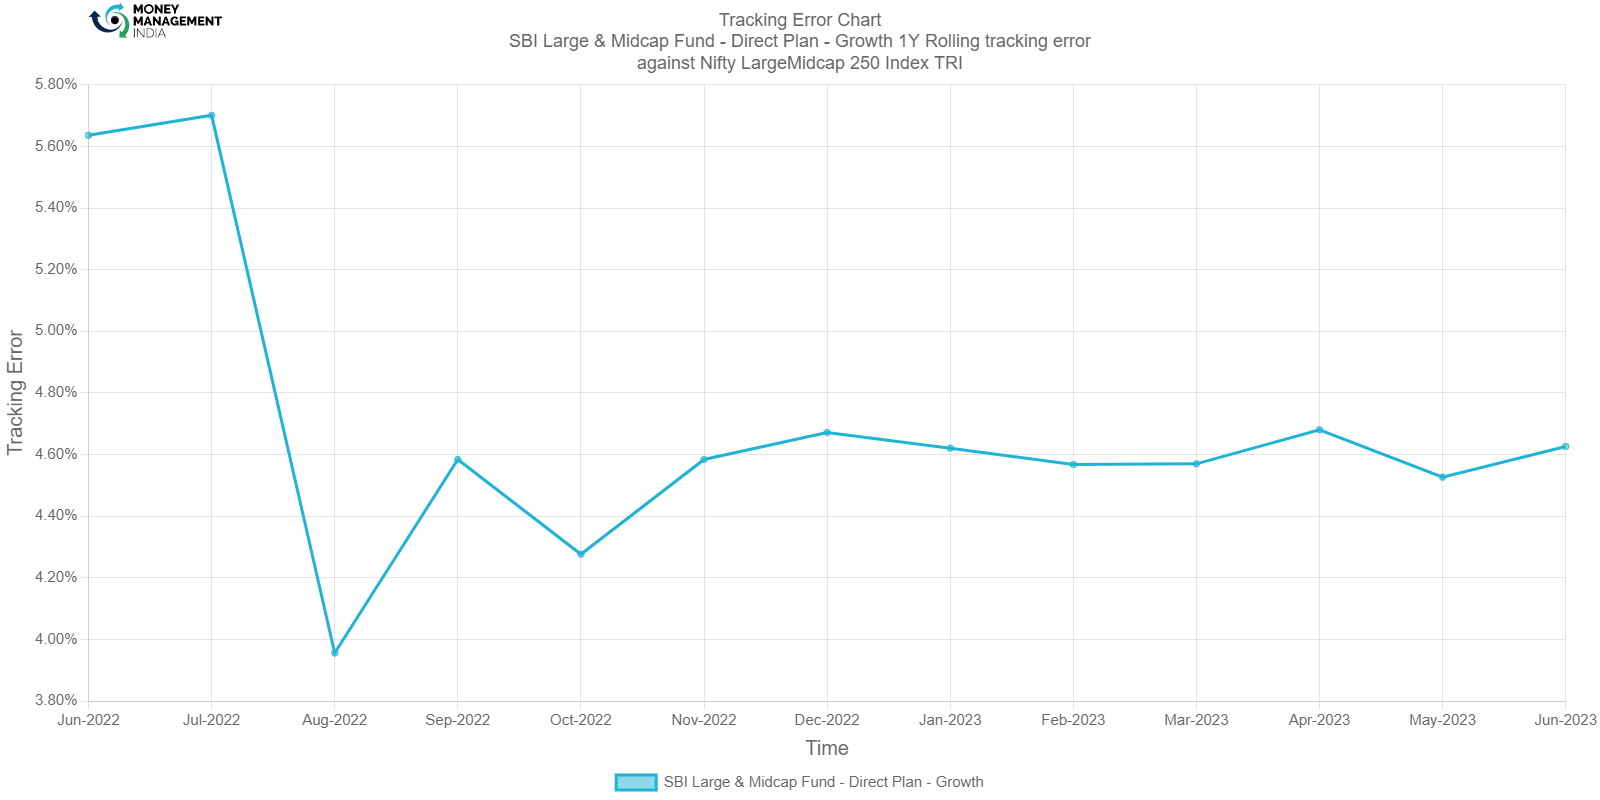
By Aug 2022 TE was 3.9560%, the fund became reasonably active and maintained a TE range between 4-6% till Jun 2023. Active management has given a high TE in recent times.
Information Ratio
The information ratio is a measure of risk-adjusted return as its excess return per excess unit of volatility. Active funds must have an IR higher than 1, higher than 1.3 is considered ideal.
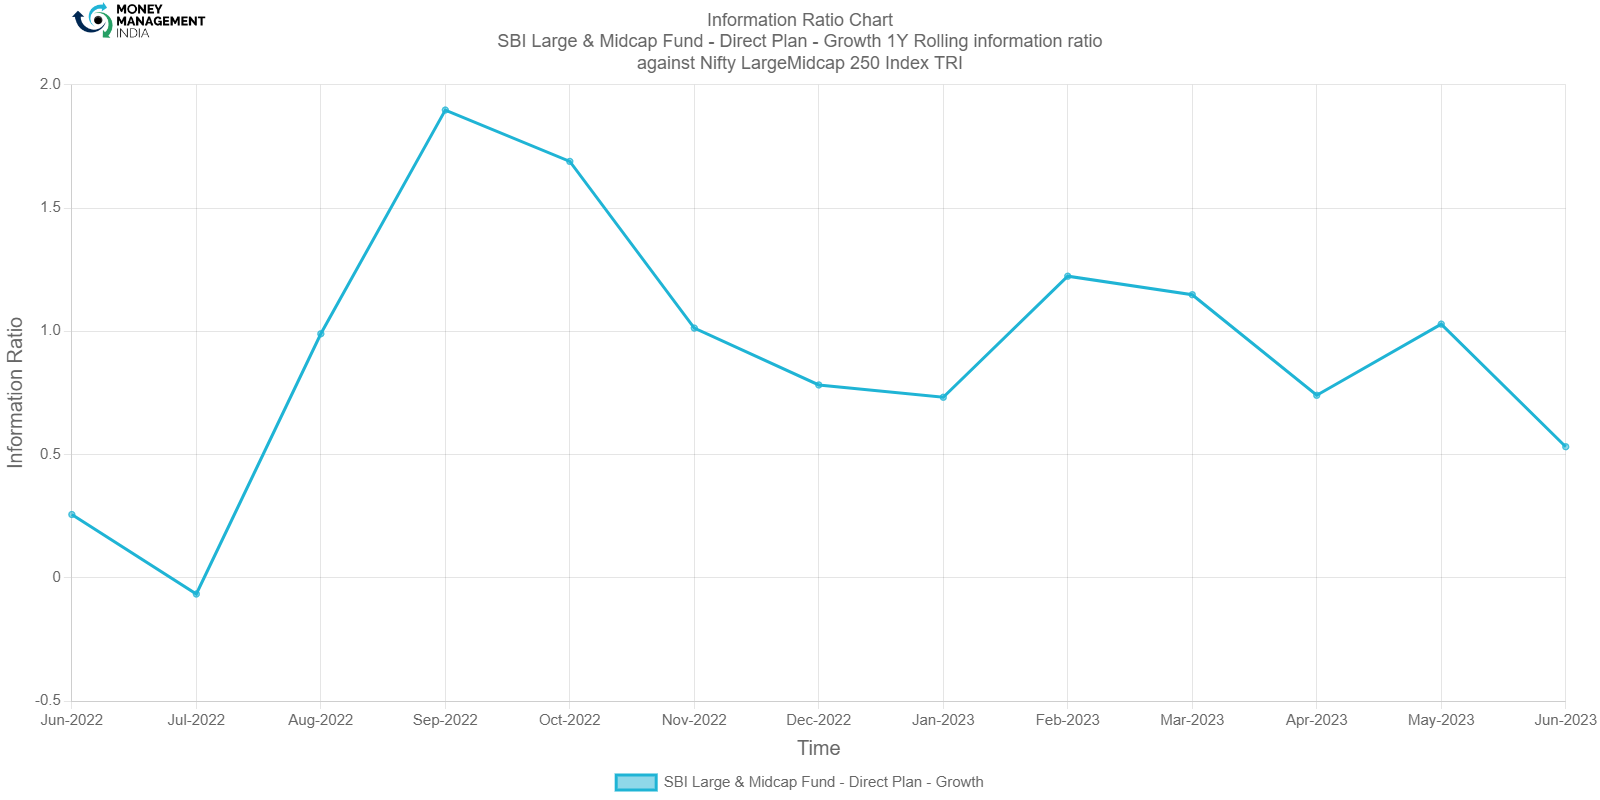
IR of the fund faced an all-time low of -0.0660 in July 2022. Later, the fund recovered and reached the maximum level of 1.8980 in Sep-2022. The fund’s active management combined with high risk, led to the deterioration of IR in the following periods. IR once again, went down to 0.7320 in Jan 2023. IR currently fluctuates between 0-1.5 in recent times.
Portfolio analysis
Stock style chart
Morningstar’s stock style chart shows the ‘style’ of the stocks in the portfolio in terms of size and value/growth style. The centroid shows the weighted average while the zone circle shows how varied the stock styles are.

The weighted average of the fund is closely related to that of the category average. Blended and growth make up the largest asset classification in this fund. It ranges from large cap to mid-cap.
Factor profile chart
Morningstar’s factor profile shows the historical style analysis of the stocks in the portfolio in terms of size, value/growth style, and other key factors. The blue circle shows the fund relative to the black dot for the category average.

Some level of historical range is seen in all the factors, this is due to the active management strategy. The style factor indicates that the fund is growth-oriented. Low yield and high momentum show that the growths of assets are slightly lower than the average level. The fund seems to have a good number of quality stocks. Volatility has great variation due to the fluctuation of returns. The long-term fund has lower liquidity which could be either due to the nature of the investment or the management could be reinvesting. The fund is a mid-cap.
Prepared by Sai Mahesh, August 2023
You must be logged in to post a comment.