ISIN INF204K01K49
Overall analysis
3-yr rolling excess returns and TE against benchmark have been good overall; but the funds’ performance in the short run has been deteriorating. TE of the fund shos that the fund is not being actively managed. The IR of the fund is ideal and upto the benchmark.
Performance analysis
Rolling returns in quartiles
The rolling return chart shows excess 3-year annualised returns in context of peer return quartiles. The blue line’s time above the third green median line indicates the fund’s better than median performance.

The 3Y rolling excess chart shows that the fund had generated alpha in the start but from mid 2018 till mid 2021 the fund deteriorated and generated negative returns with 3.20% in Dec 2020. The fund has been outperforming the benchmark since and generated alpha returns, it is currently at 4.90%.
Rolling risk/return (Snail-trail)
The rolling risk/return chart shows excess 3-year annualised returns relative to the index. The top left quadrant would indicate higher returns with lower volatility than index.
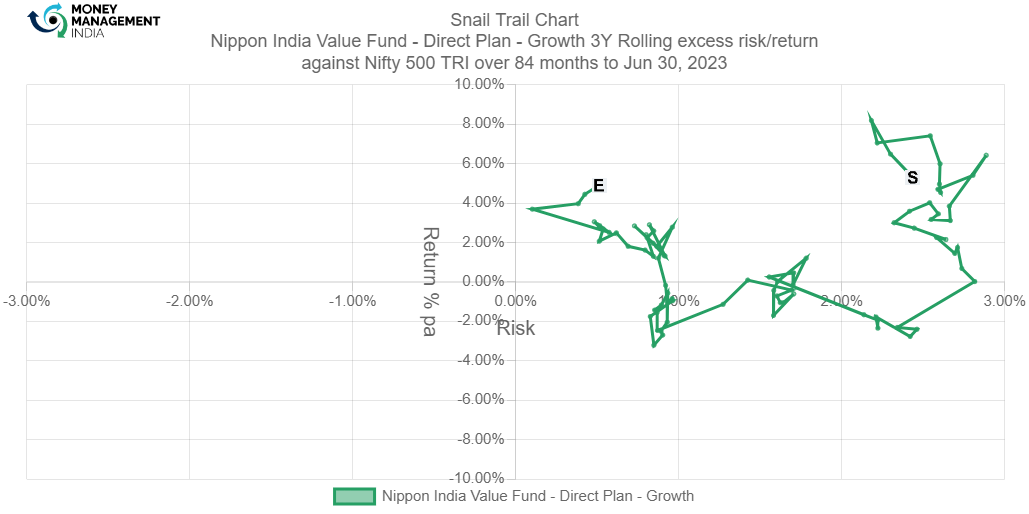
The snail trail chart of the fund rolling excess risk/return shows that the fund had a good start as it made alpha returns. From mid 2018 to mid 2021, the fund wasn’t performing the best and hence generated negative returns with negative risk. The fund is at a good position by the end of May with a return of 4.4%.
Tracking error
The tracking error chart shows how the fund ‘tracks’ against the index. The higher the TE, the more active the fund’s return has been, with the 2-4% range considered to be barely active, 4-6% range considered to be reasonably active and anything higher attributed to concentrated/focused funds. Funds with TE of less than 2% can be considered to be closet indexers.
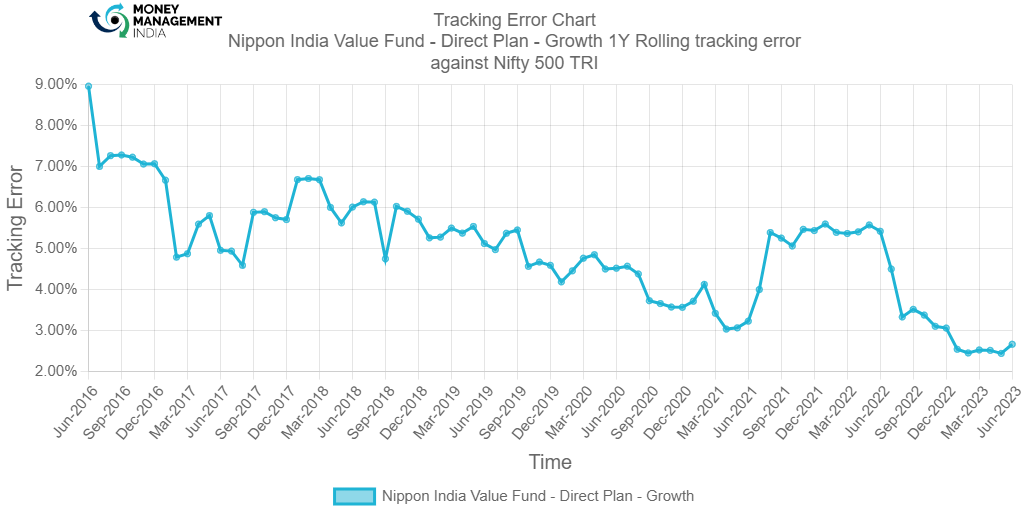
TE of the fund was reasonably active in the start with the high of 8.9% TE. TE of the fund has been declining over the years and currently is at 2.6%. The fund was reasonably active then it went to being moderately active and now it is closet indexers.
Information ratio
The information ratio is a measure of ‘risk-adjusted return’ as it’s the excess return per unit of excess volatility. Active funds should have IR of higher than 1, ideally higher than 1.3 at least to indicate skill.
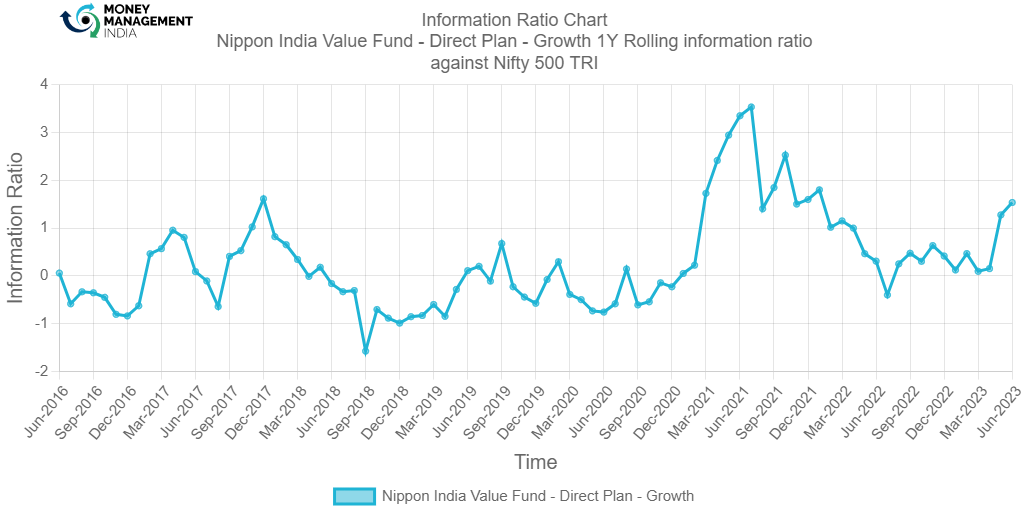
As the TE of the fund went below the IR of the fund has been performing well to the expected benchmark since Mar 2021. IR of the fund is currently at 1.5%.
Portfolio analysis
Stock style chart
Morningstar’s stock style chart shows the ‘style’ of the stocks in the portfolio in terms of size and value/growth style. The centroid shows the weighted average while the zone circle shows how varied the stock styles are.

The stock style of the fund is slightly different from the category average. The centroid of the fund is in the large blend section. The ownership zone of the fund shows that the investments are made in majorly large-blend and large-growth stocks, some investments can be seen in the value oriented stocks and mid cap stocks.
Factor profile chart
Morningstar’s factor profile shows the historical style analysis of the stocks in the portfolio in terms of size, value/growth style and other key factors. The blue circle shows the fund relative to the black dot for the category average.
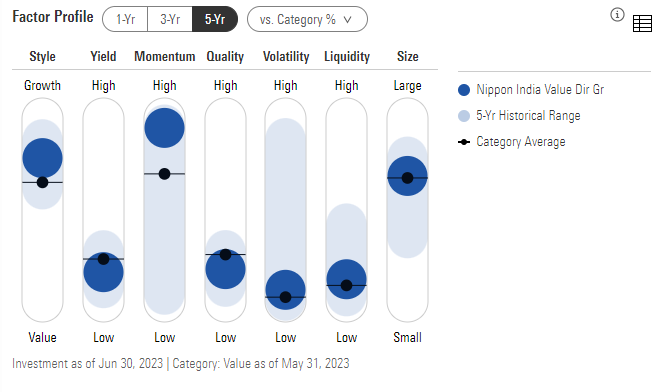
The style of the fund is closer to the blend orientation. The yield of the stock is quite low. The assets have grown by the period as the momentum is closer to high. Profitability of the fund is low, the fund seems very volatile as the historical range is wide. The liquidity of the fund is closer to being low. The market capitalization of the category average is closer to mid-large cap.
Prepared by – Ayushi Shervegar, August 2023
You must be logged in to post a comment.