INF204K01XF9
Overall analysis
3-years rolling excess returns of the fund has outperformed its benchmark and its peers. Overall, this fund TE is closer to the index. It has a good IR 2.2; the fund is generating risk adjusted returns. Fund manager is taking more risk and generating returns. Suitable for the investor with high-risk appetite.
Performance analysis
Rolling returns – 3 years rolling excess returns over 7 years.
Snail trail – 3 years rolling excess risk/return over 7 years.
Tracking error – 1 year rolling tracking error.
Information ratio – 1 year rolling information ratio.
Rolling returns in quartiles
The rolling return chart shows excess 1Y-year rolling return in context of peer return quartiles. The blue line’s time above the third green median line indicates the fund’s better than median performance.
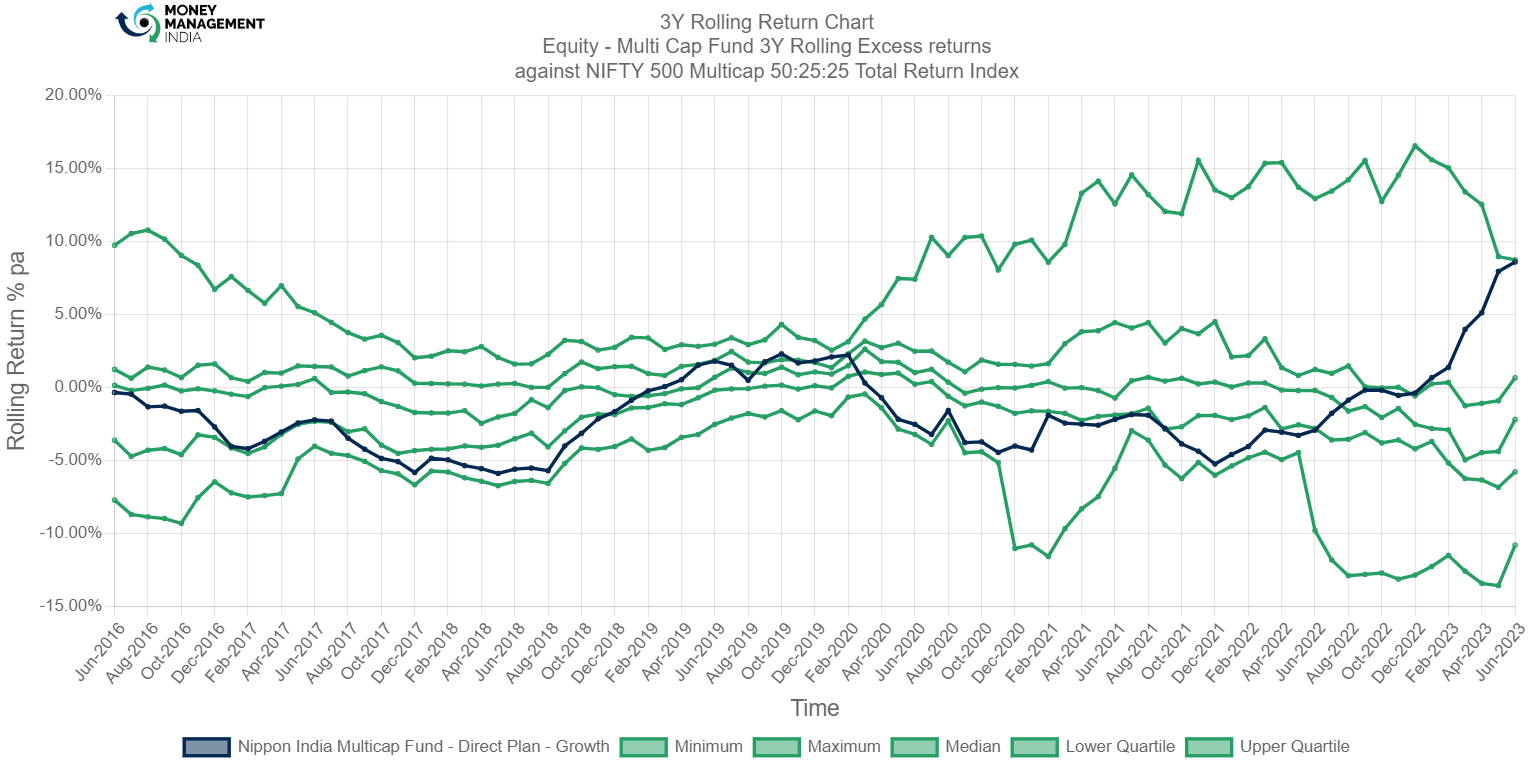
3 years rolling excess returns have been negative from June 2016 till February 2019 investors suffered the negative returns against its benchmark, further it grew and started generating positive returns with the highest figure of 2.31%. Later in April 2020 the fund again started falling, maybe due to pandemic crisis & underperformance continued till December 2022. In January 2023 the fund started growing at a fast pace- now, as of June 2023 the returns stand with the maximum (green) line with the figure to 8.6% outperforming the benchmark index.
Rolling risk/return (Snail-trail)
The rolling risk/return chart shows excess 1-year annualized returns relative to the index. The top left quadrant would indicate higher returns with lower volatility than index.
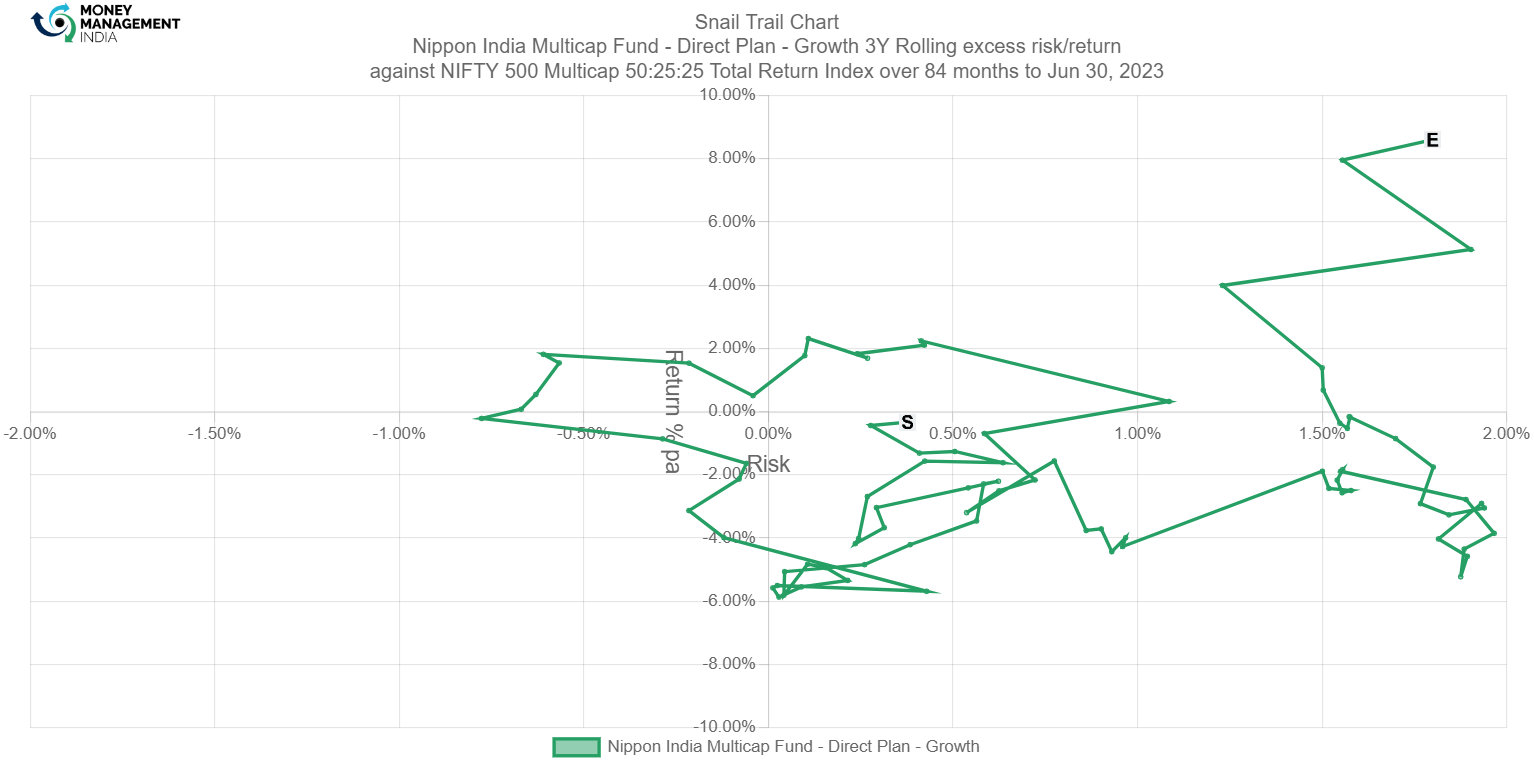
Snail trail Indicator has its prints around top & bottom right quadrant, most of the time it has gone through positive excess risk and negative excess returns against its benchmark. Looking at the end point we can conclude that the fund is taking more risk but yes it has generated positive returns 8.60% by taking the risk of 1.8%. This fund is not recommended to the investors with less risk appetite.
Tracking error
The tracking error chart shows how the fund ‘tracks’ against the index. The higher the TE, the more active the fund’s return has been, with the 1-3% range considered to be low TE, 3-6% range considered to be moderately active and anything higher than 6% is high TE. Funds with TE of less than 2% can be considered to be closet indexers.

1 year rolling tracking error has been around the levels of 4% to 13%, Overall, the fund sometimes has been moderately active & sometimes highly active. It had the highest TE of 12.7% in the month of February 2021.
Information ratio
The information ratio is a measure of ‘risk-adjusted return’ as it’s the excess return per unit of excess volatility. Active funds should have IR of higher than 1, ideally higher than 1.3 at least to indicate skill.
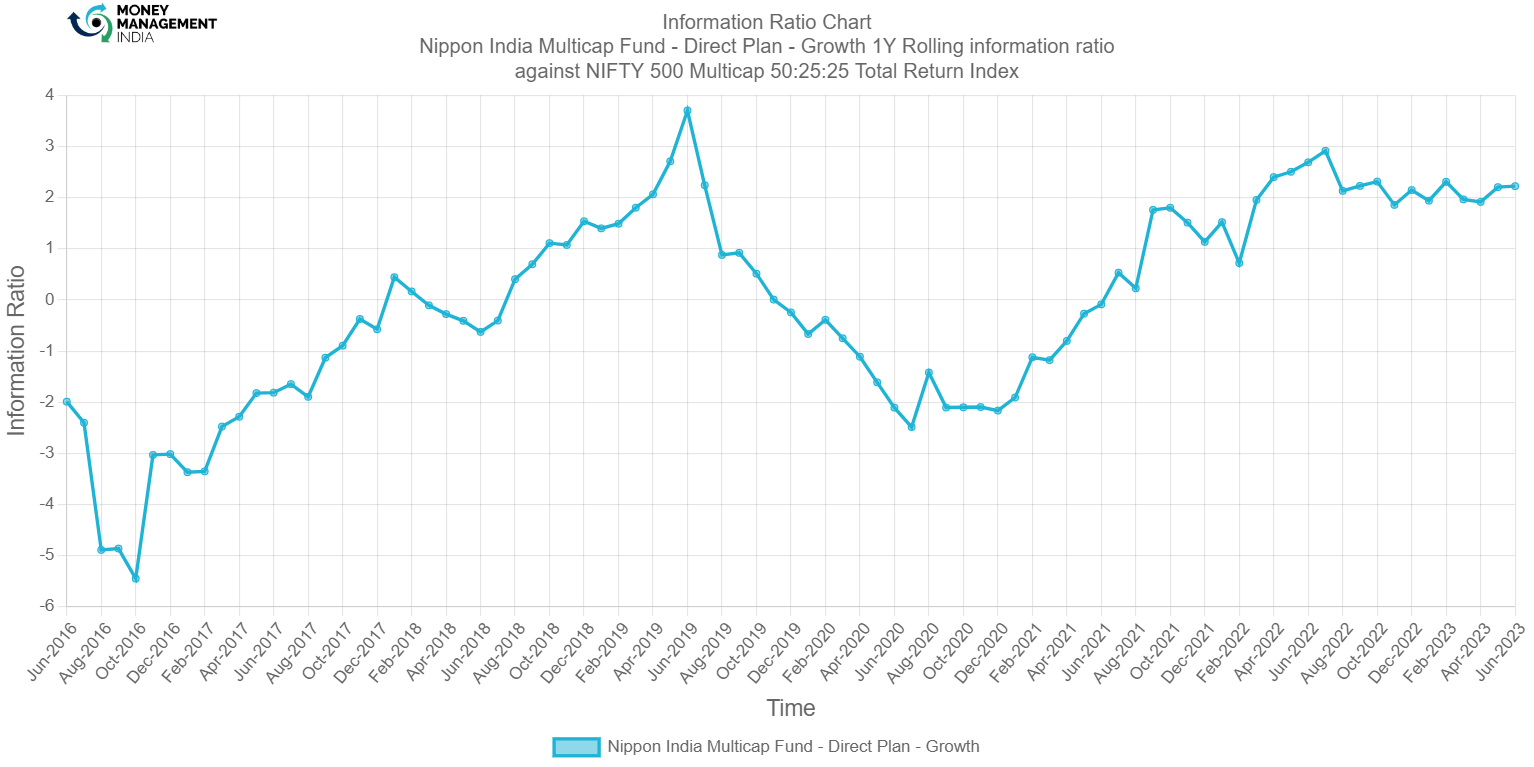
The 1 year rolling information ratio of this fund has decent growth; From Mid 2016 to Mid 2018 the fund had negative IR, Later the IR raised and the fund coped up touched the high of 3.7. Currently it has an IR of 2.2.
Portfolio analysis
Stock style chart
Morningstar’s stock style chart shows the ‘style’ of the stocks in the portfolio in terms of size and value/growth style. The centroid shows the weighted average while the zone circle shows how varied the stock styles are.

The centroid indicator of this fund lies at the top right corner of the stock style chart box- which indicates that; the portfolio of this fund has weightage over large cap- growth category stocks while its peers also has similar securities in its portfolio basket. Ownership zone indicator ring says that; the fund has picks around all the caps (small, mid & large) with blended & Growth category stocks, but has less involvement in small cap & no involvement in value oriented securities. While other multi-cap funds indicated by the yellow (ring)- indicates that its category has channelised its funds only into mid, large- growth & blended types of stocks.
Factor profile chart
Morningstar’s factor profile shows the historical style analysis of the stocks in the portfolio in terms of size, value/growth style and other key factors. The blue circle shows the fund relative to the black dot for the category average.
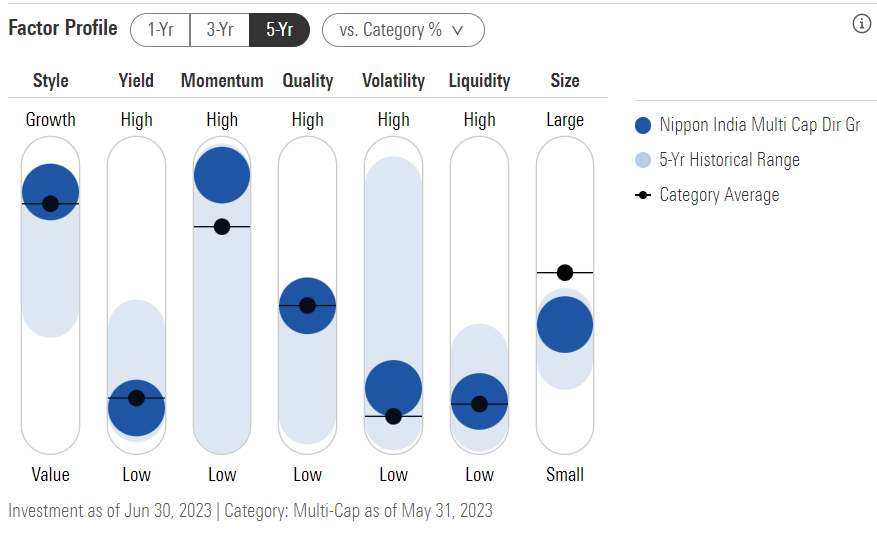
Morningstar’s factor profile chart demonstrates that yield/returns is as low as its category average & has declined- as shown by 5yr historical range indicator, while volatility & liquidity is low & according to the 5 years historical range it has been decreased till date. Momentum of the securities held & traded is high & has outperformed its category average. Overall quality of the stock picks is average as same as its peers. Therefore the portfolio stocks are interchanging to growth stocks throughout the 5 years historical range. Size indicator states; it is small & low as compared to its category.
Prepared by – Hemanth Reddy, August 2023
You must be logged in to post a comment.