ISIN INF247L01999
Overall Analysis
The 1-year rolling returns and snail trail analysis indicate that the fund’s performance against the benchmark was good. High TE indicates that the fund is being actively managed. IR indicates that the fund provided an impressive return compared to the benchmark. The fund is now among the top-performing funds in this category of funds.
Performance Analysis
Rolling returns in quartiles
The rolling return chart shows excess 3-year annualized returns in the context of peer return quartiles. The blue line’s time above the third green median line indicates the fund’s better than the median performance of the benchmark.
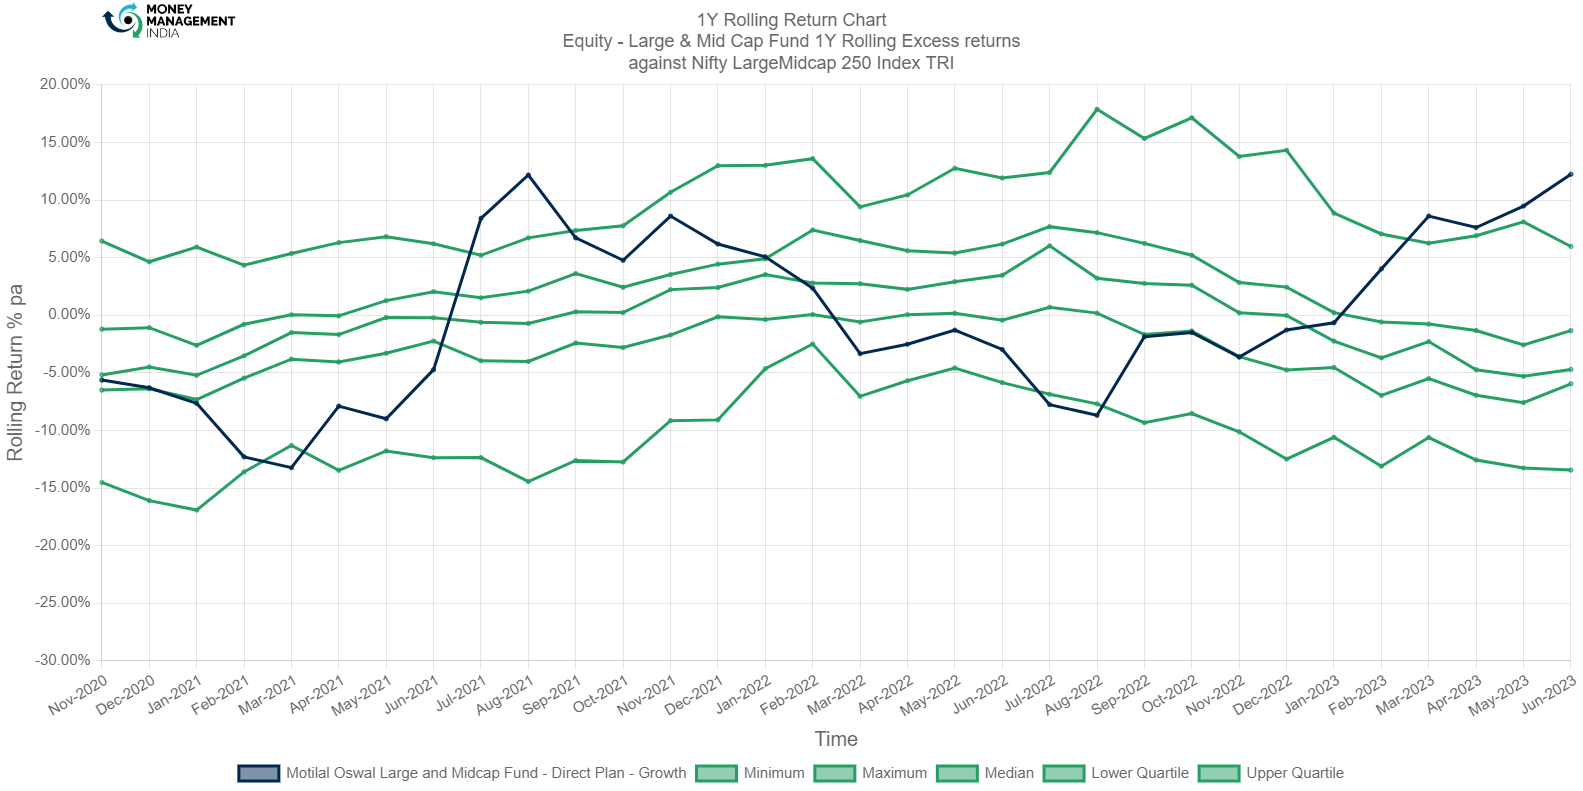
The 1-year rolling returns show that the fund performed better than the index and outperformed the median. The fund first had its uptrend in 2021 from Apr-Aug. Then, the fund’s return deteriorated from Aug 2021- 2022. Currently, the fund has a return level of 12.24% on Jun-2023.
Rolling Risk/return (snail-trail)
The rolling risk/return chart shows excess 3-year annualized returns relative to the index. The top left quadrant would indicate higher returns with lower volatility than the index.
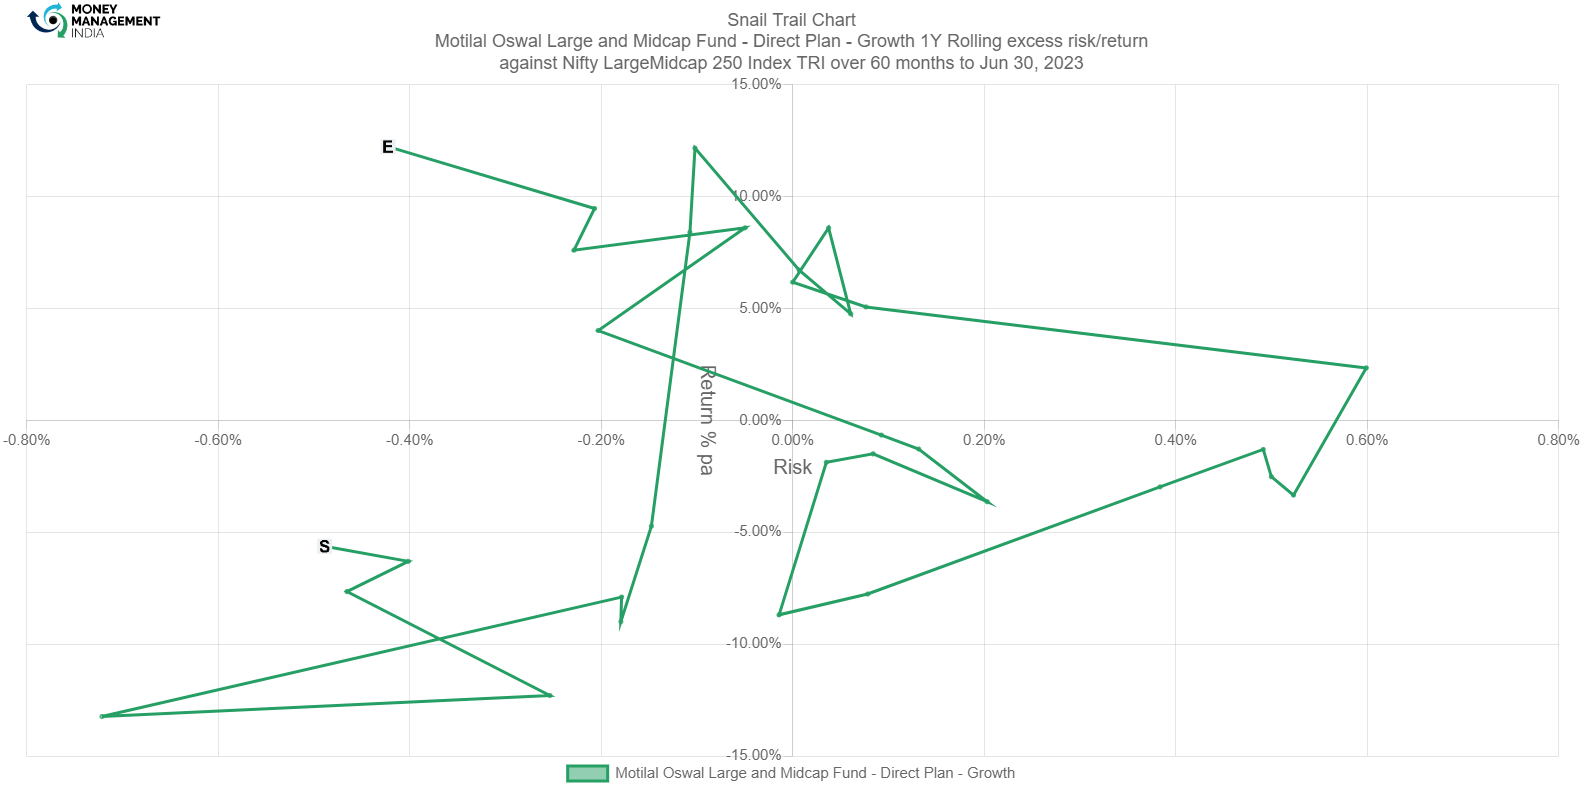
Snail trail shows that the fund did start off in the lower quartile, but eventually started outperforming the benchmark with relatively low risk ranging -0.148%- 0.599%. The outperformance started deteriorating by March 2022 but gained back its pace by Feb 2023. The fund currently has a return of 12.24%.
Tracking Error
The tracking error chart shows how the fund ‘tracks’ against the index. The higher the TE, the more active the fund’s return has been, with the 2-4% range considered to be barely active, the 4-6% range considered to be reasonably active, and anything higher attributed to concentrated/focused funds. Funds with TE of less than 2% can be considered to be closet indexers.
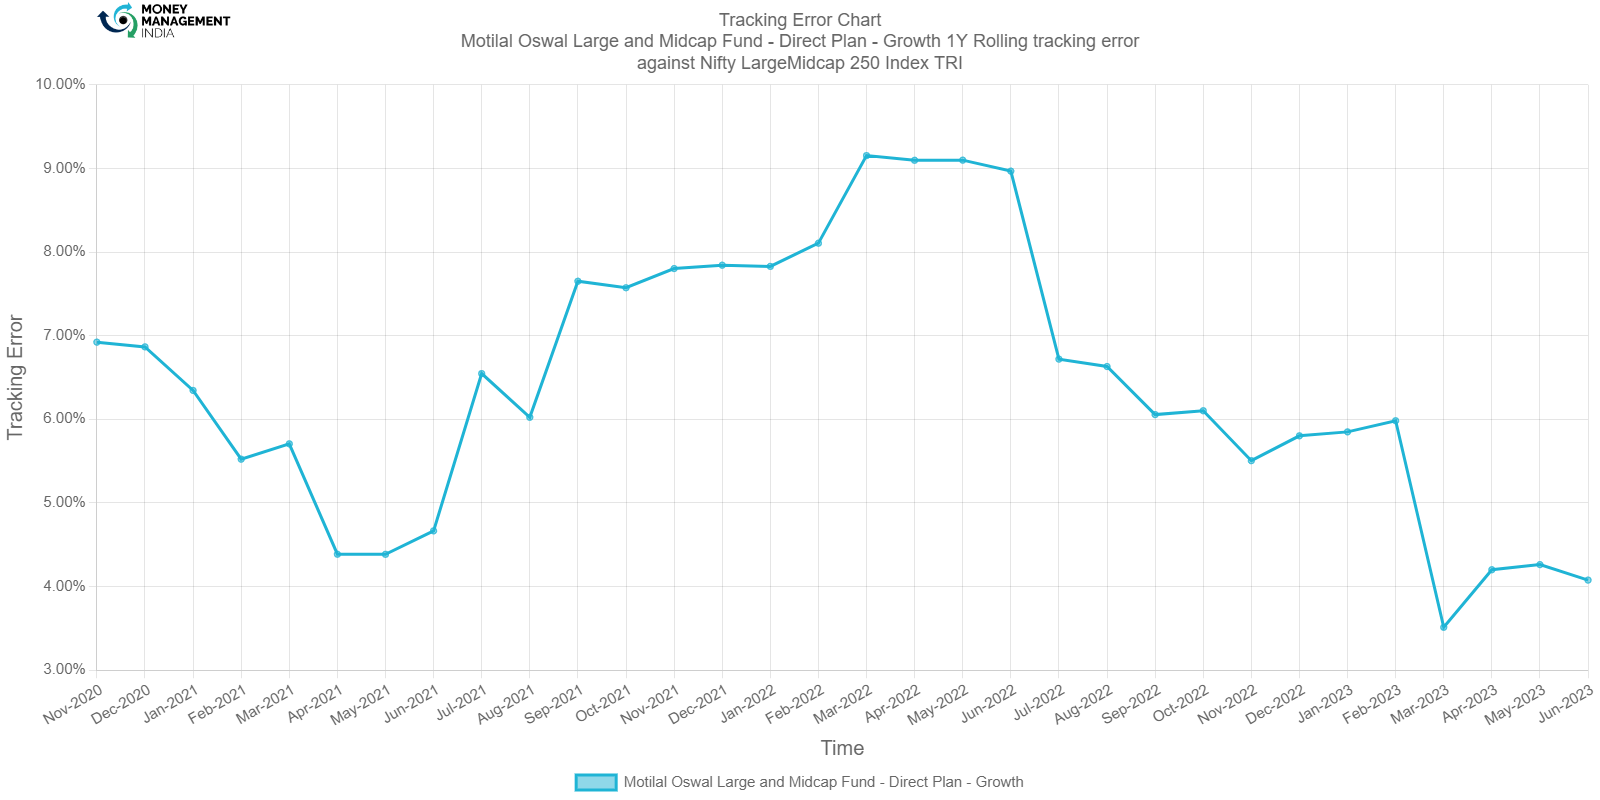
The TE is due to the active management at an average level between 4-6%. By May 2022, the fund’s TE was 9.1530%. TE came down to an all-time low of 3.5140% in March 2023. TE as of Jun-2023 stands at 4.0780% indicating active management.
Information Ratio
The information ratio is a measure of risk-adjusted return as its excess return per excess unit of volatility. Active funds must have an IR higher than 1, higher than 1.3 is considered ideal.

By Aug 2022, IR was -1.3100 and then it increased to 2 on Aug 2021. Then due to extreme volatility, IR came back down to -1.3100 on August 2022. As of June 2023, the fund’s IR is 3.0010 indicating the fund provided impressive risk-adjusted returns.
Portfolio analysis
Stock style chart
Morningstar’s stock style chart shows the ‘style’ of the stocks in the portfolio in terms of size and value/growth style. The centroid shows the weighted average while the zone circle shows how varied the stock styles are.

The centroid shows that the fund is diversified the same as the category average. The fund’s weightage is equally spread in large-cap blended, growth stocks, and mid-cap growth stocks.
Factor profile chart
Morningstar’s factor profile shows the historical style analysis of the stocks in the portfolio in terms of size, value/growth style, and other key factors. The blue circle shows the fund relative to the black dot for the category average.
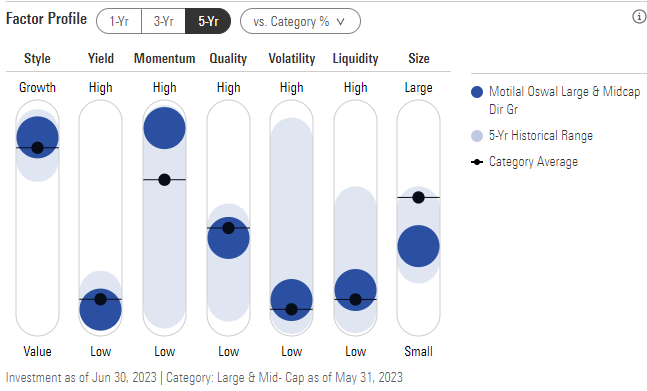
The fund is growth-oriented. Low yield and high momentum can be explained by the diversification of investments among growth stocks. The fund has a reasonable quality, with low volatility and liquidity. The fund’s capital size is mid.
Prepared by Sai Mahesh, August 2023
You must be logged in to post a comment.