INF00XX01168
Overall analysis
3-years rolling excess returns of the fund is negative throughout the year. Overall, this fund TE has shrinked & it been moderately active, IR is average. The fund gave the least returns in comparison to its peers. It has negative risk and returns as shown further in detail.
Performance analysis
Rolling returns – 3 years rolling excess returns over 4 years
Snail trail – 1year rolling excess risk/return over 4 years
Tracking error – 1yr rolling tracking error
Information ratio – 1yr rolling information ratio
Rolling returns in quartiles
The rolling return chart shows excess 1Y-year rolling return in context of peer return quartiles. The blue line’s time above the third green median line indicates the fund’s better than median performance.
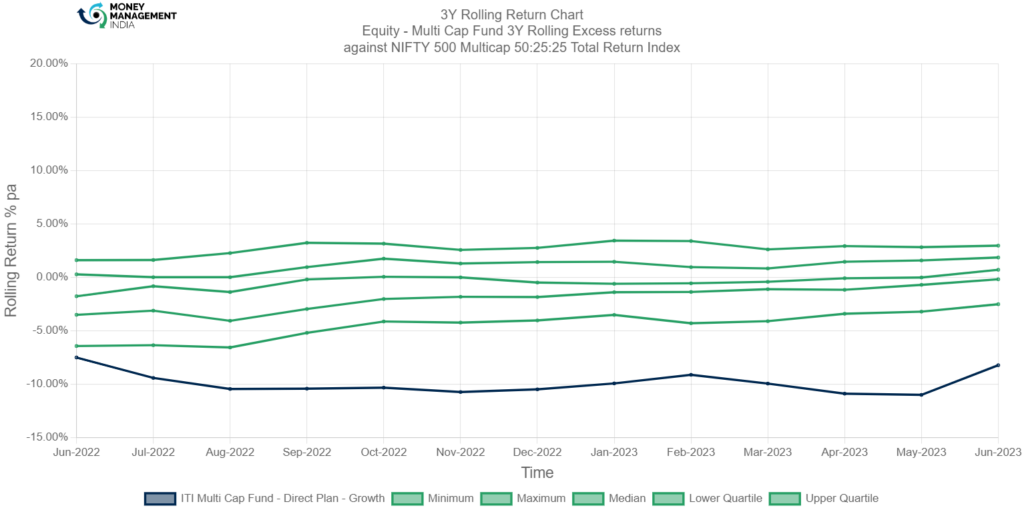
As shown in the 3 years rolling excess returns the fund’s performance stands at lowest as compared to its benchmark as well as peers, its returns are deeply negative, one can see the blue line representing the fund’s performance is below all the green line. It has the lowest 3 year rolling return of approx. -11%, which is an unattractive sign to the investors & currently stood out @ -8.2% .
Rolling risk/return (Snail-trail)
The rolling risk/return chart shows excess 1-year annualized returns relative to the index. The top left quadrant would indicate higher returns with lower volatility than index.
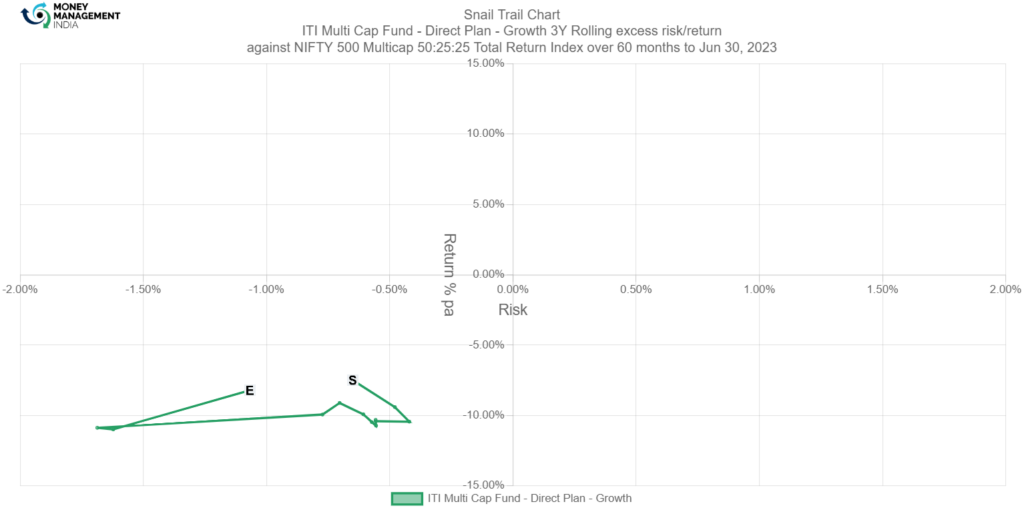
The snail trail chart shows that the fund only has rolling excess negative returns since inception. Rolling risk/return starting with June 2022; generated the 3 year rolling returns of -7.5% by taking the risk of -0.65% & ending with June 2023; generating the 3-year rolling return of -8.2% by taking the risk of -1%. Overall, the indicator has its track within lower left quadrant which means fund took negative risk and generated negative returns.
Tracking error
The tracking error chart shows how the fund ‘tracks’ against the index. The higher the TE, the more active the fund’s return has been, with the 1-3% range considered to be low TE, 3-6% range considered to be moderately active and anything higher than 6% is high TE. Funds with TE of less than 2% can be considered to be closet indexers.
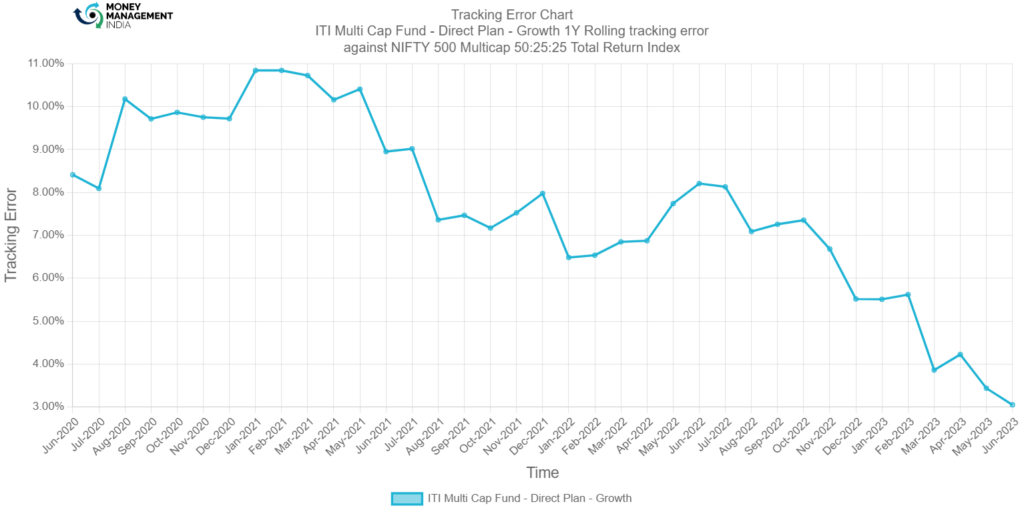
Started with a good sign of being actively managed fund high TE, achieved the highest 1 year rolling tracking error of 10.8% in the initial months of year 2021. Later on, the fund activeness declined month by month. Currently it stood at 3.05% which means fund turned highly active to moderately active.
Information ratio
The information ratio is a measure of ‘risk-adjusted return’ as it’s the excess return per unit of excess volatility. Active funds should have IR of higher than 1, ideally higher than 1.3 at least to indicate skill.
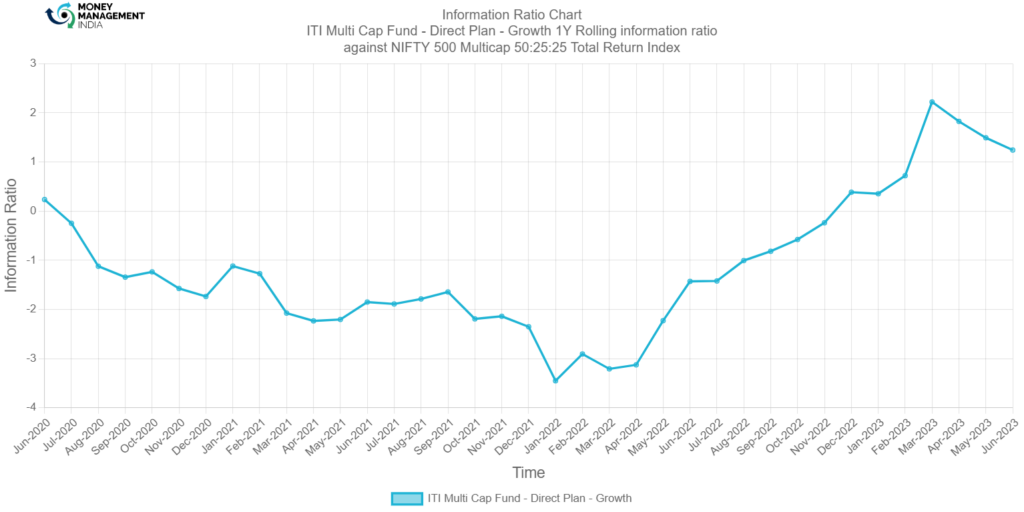
Information ratio footprints had a sharp decline from June 2020 to January 2022; marked the low of -3.4 & then after it had progressed by touching the highest IR of 2.2.
Portfolio analysis
Stock style chart
Morningstar’s stock style chart shows the ‘style’ of the stocks in the portfolio in terms of size and value/growth style. The centroid shows the weighted average while the zone circle shows how varied the stock styles are.

The centroid indicator of this fund lies at the top right corner of the box- which states that; portfolio of this fund contains more weightage of large cap stocks of growth category. Ownership zone indicator bespeak that the fund has picks around all the caps (small, mid & large) with all the 3 categories (value, blended & Growth) stocks, but has less involvement in small cap stocks & value oriented stocks. While other multi-cap funds indicated by the yellow (ring)- says that its category has chanelise its fund only into mid, large- growth & blended type of stocks.
Factor profile chart
Morningstar’s factor profile shows the historical style analysis of the stocks in the portfolio in terms of size, value/growth style and other key factors. The blue circle shows the fund relative to the black dot for the category average.

Morningstar’s factor profile chart shows that the portfolio has its most weightage over growth stocks, returns of the fund are low; similar to its category average. Overall volatility & liquidity of the stocks in the portfolio has declined in the 5 years historical range & stands at low point; again which is also same as its category average, momentum of the stocks traded in the portfolio is quite impressive, it has more momentum stocks in its cart as compared to its peers. Quality of portfolio stocks has changed drastically in the 5yr historical range & it is indicating towards high as compared to its peers.
Prepared by – Hemanth Reddy, August 2023
You must be logged in to post a comment.