Performance analysis
Rolling returns in quartiles
The 3 year excess rolling returns are negative across the corporate bond. The blue line is mostly in the 2nd/3rd quartile.

The fund started in the fourth quartile and stayed below the median for the maximum period. As of Feb 2023 the fund is at -0.5%.
Rolling risk/return (Snail-trail)
The standard deviation on the 3 year excess returns range between -1% to 3%. overall there is high volatility in the fund.
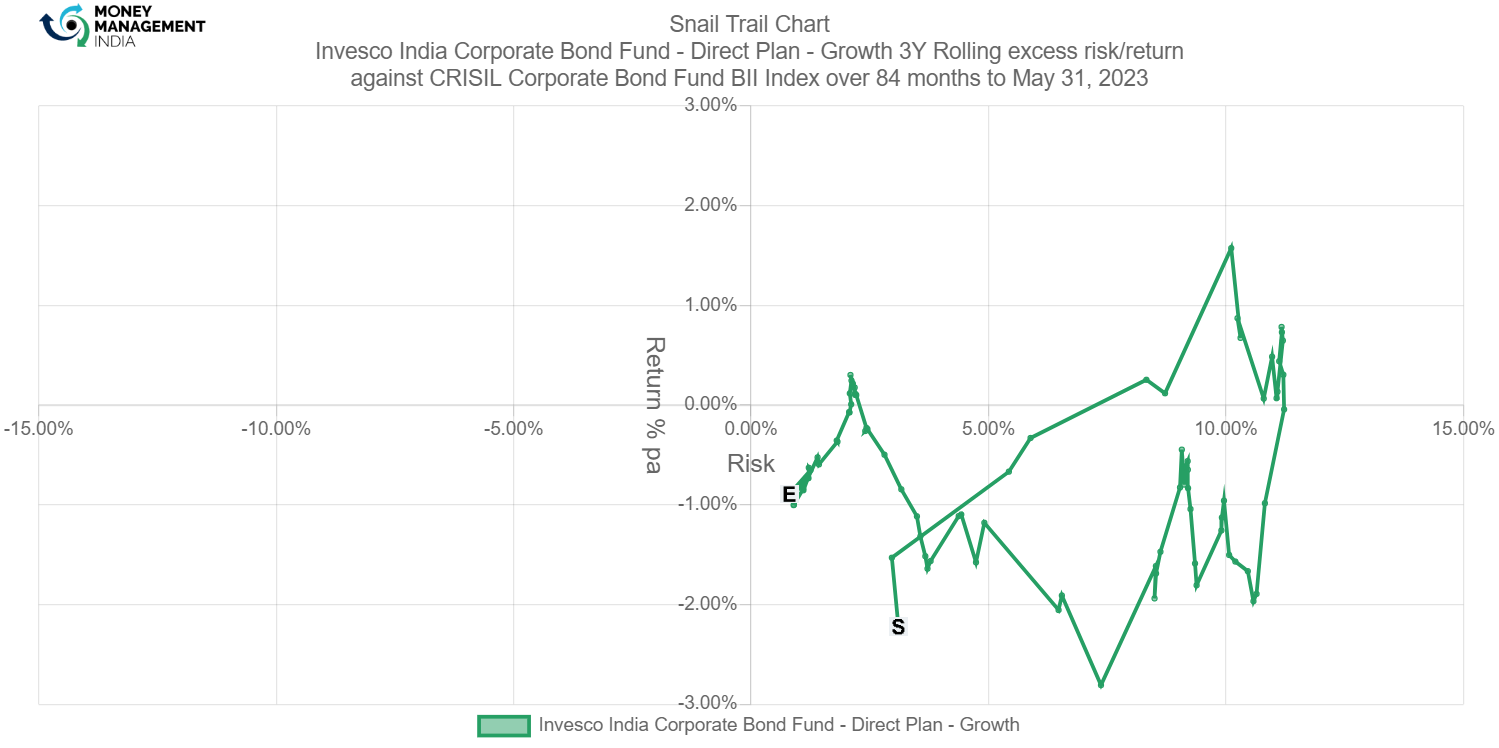
The snail trail indicates that the fund when started had negative returns of about -2.1% and risk of 3%. As of May 2023, the returns are -1% and the risk reduced to 1 %.
Tracking error
The tracking error ranges between 0 to 2

The TE started at 1.3% in the month of May 2020, but it gradually decreased later for the period. As of May 2023, the TE is at around 0.3%.
Information ratio
The information ratio ranges between 0 to -3.5. The overall ratio has been mostly below 0.

The IR was positive only for 3 months i.e. May 2020 to July 2020. The IR for the entire period is negative. The IR also touched -5 in the month of Sep 2022. As of now the IR is at -2 %.
Prepared by – Ganesh Hulke
You must be logged in to post a comment.