
While retail investors and advisers track various performance-based quantitative parameters such as excess returns and Sharpe ratio on mutual fund fact sheets, the professional investment consulting industry uses more advanced measures such as tracking error and information ratio to evaluate active funds. We calculated and analysed these measures for the Indian equity fund universe with the aim to get a feel for typical levels. We also wanted to start segmenting the Indian active funds universe by tracking error so investors can use this segmentation for portfolio construction purposes.
Introduction
While investors are no doubt familiar with the standard disclaimer that ‘past performance is not a good guide to future performance’, it’s human nature to consider the ‘track record’ of the active funds that investors are considering to invest their hard-earned money into. Indeed investors should consider both performance- and portfolio- based quantitative measures, in addition to qualitative factors such as investment philosophy/style, process/risk management, people and business management. In practice, performance clouds other factors. We propose that if investors are considering performance, they should at least look at more informative measures than simply excess returns, and that too over a longer period of time.
Popular fact sheets show period returns, quartile position against peers, volatility as a measure of risk (standard deviation) and oftentimes the ‘Sharpe Ratio’. While the standard deviation and Sharpe Ratio are excellent measures of risk and risk-adjusted returns respectively, professional investors focus on returns against the appropriate benchmark index for fund selection. Hence, they use a measure called tracking error and a modified or ‘selection Sharpe Ratio’, also called Information Ratio.
Let’s explore these relative measures.
Using relative risk/return rather than absolute
The Sharpe Ratio (SR) is basically the return per unit of risk. It’s used to ‘risk adjust’, using absolute returns over the risk free rate, and an absolute measure of risk that is the standard deviation. It is an excellent way to compare assets across different asset classes, such as a stock and a bond. It is also used to compare portfolios.
For example, consider two portfolios: Portfolio A has returns of 15% and Standard deviation of 8% and Portfolio B has returns of 10% and Standard Deviation of 4%. Without incorporating the risk Portfolio A offers higher returns.
Now, let’s ‘risk adjust’. Let’s say that the risk free rate is 3%. The SR for each would be
Portfolio A = (15-3)/8 = 1.5
Portfolio B = (10-3)/4 = 1.75
Hence, Portfolio B is better than A on a risk-adjusted basis as it has a highest Sharpe ratio.
In funds selection, investors and advisers are more interested in picking funds within an asset class or segment. So absolute risk-adjusted return is less relevant; we should look for relative risk adjusted returns.
Tools like Tracking Error and Information Ratio can be used to measure the relative risk adjusted returns or performance.
Tracking Error (TE) of a fund shows the difference between the benchmark’s return and the portfolio’s return. It can be used to provide a range of relative performance when evaluating a fund manager. Simply put, it measures how actively a fund is managed. Higher the TE the more the manager has deviated from the benchmark. High tracking error may be caused by style bets, security selection, transaction costs, and fees.
Information Ratio (IR) is considered a risk adjusted measure of performance focusing on active return relative to active risk. For funds to consistently generate alpha, they will have some tracking error. Funds striving for higher alpha will have higher TEs. Hence, the TE can be used to assess the skills of a fund manager to generate excess returns in comparison to the benchmark; IR of 0.5 and above is considered to be good as it means that the risk taken by the fund manager has paid off and it has resulted in excess returns.
While SD shows how volatile the security (or fund) has been, the TE shows how close (or far) the fund has ‘tracked’ the benchmark. An active fund can have a high or low SD depending on whether the fund is investing in low volatility stocks or making cash calls. However, active funds are likely to have higher TEs.
While SR tells the investors how much they were compensated for taking risks, while the IR tells the investors the rewards the fund manager generated by deviating from the benchmark. IR is a better measure in evaluating the relative risk- adjusted returns of a fund.
We can also study the correlation between TE and IR. While fund managers take active bets (shown by higher TE), not all of them translate to positive excess returns and hence higher IR.
How active are Indian equity funds – segmenting by TE
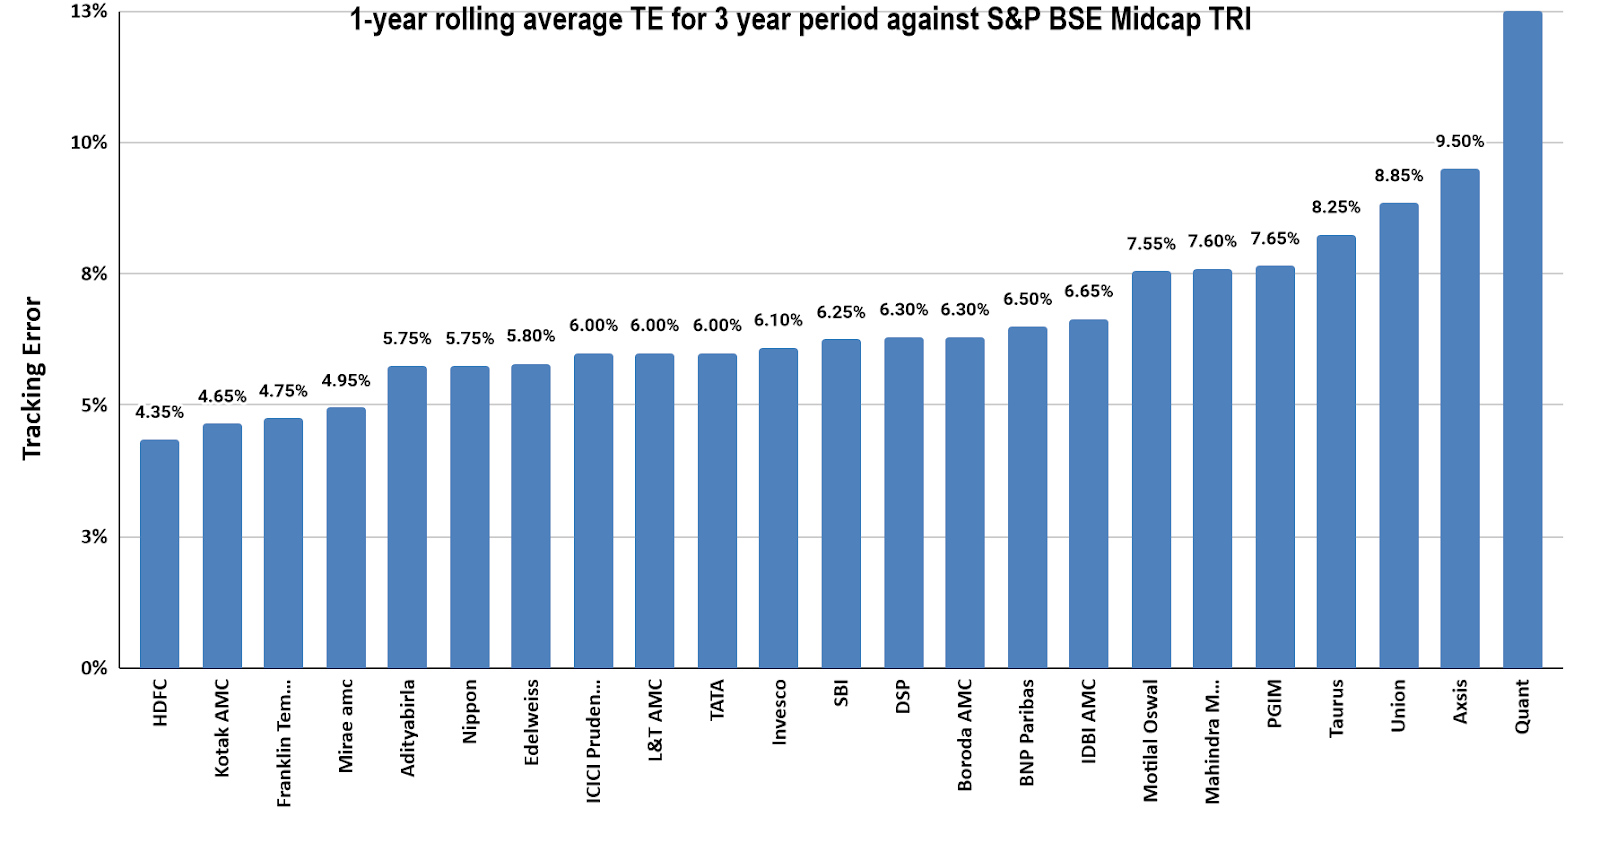
While some fact sheets show the snapshot TE at a certain date, we wanted to see if Indian equity funds showed stable TE over time. So we used the MMI Quant Tool to chart TE of 1-year rolling returns over time, such as in the chart below –

While we would have liked to analyse over longer periods of time, we considered that SEBI’s standardisation of MF classifications only occurred in 2017 so it would be meaningless to compare TE within classifications. We settled on analysing TE over three (3) years ending December 2021. We wanted to classify the funds by their ‘usual or average TE’ so we took the average of their TE over this 3 year period.
Equity large cap funds showed TE averages of 2% to 5% over this period.

Equity mid cap funds showed average between 4.4% to 9.5% over the period. Quant’s mid cap fund was an outlier with TE of 12.5%.
Equity small cap funds had average TE of between 3.1% and 8.3% over the period. Quant’s small cap fund was an outlier with a TE of 16.7%

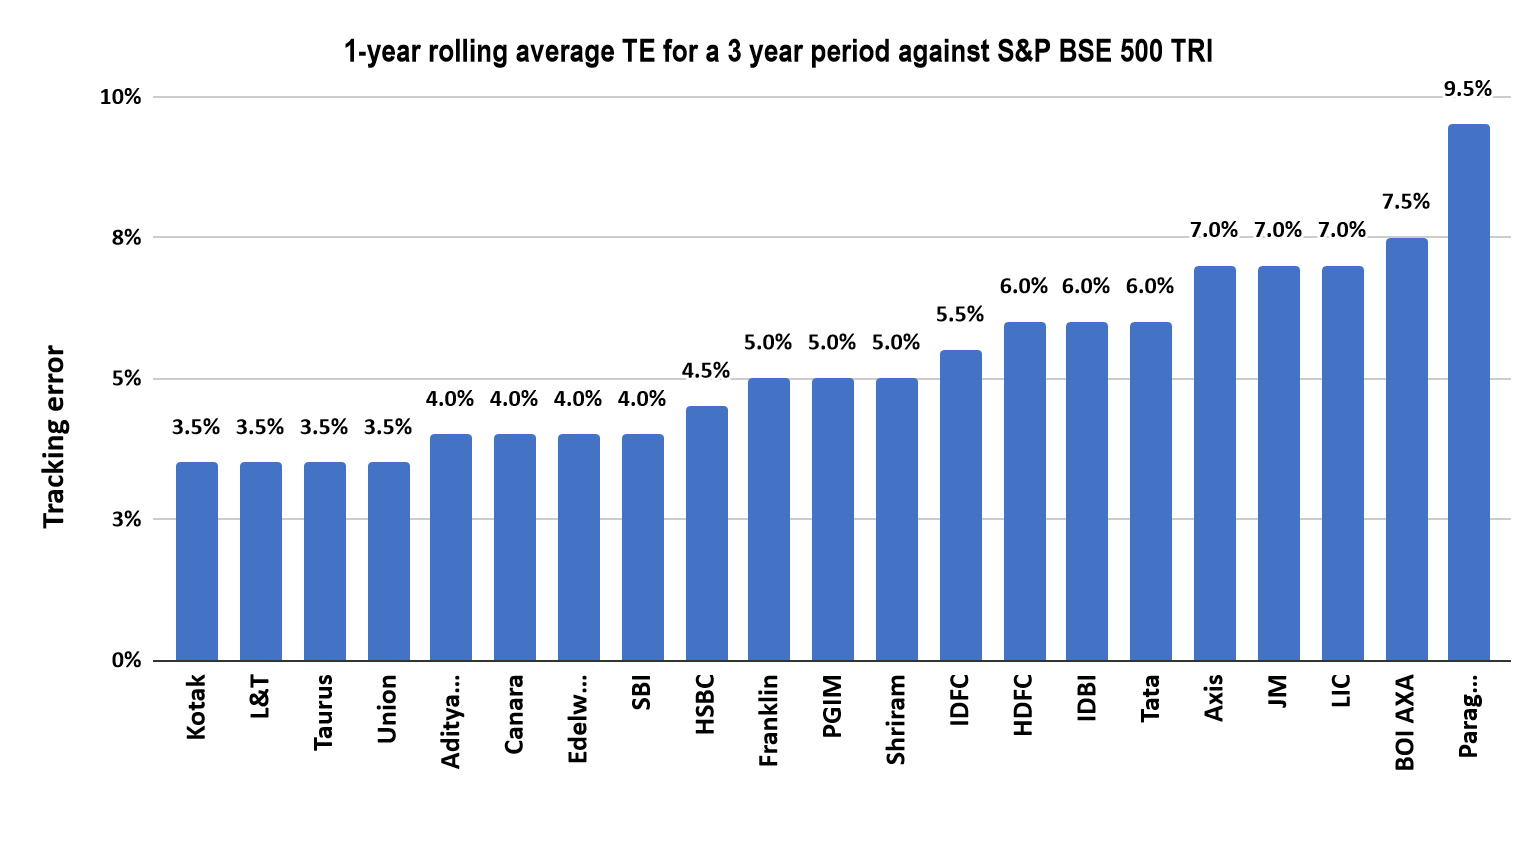
Equity flexi cap funds had average TEs of between 3.5% and 7.5% over the period. PPFAS’s flexi-cap fund was an outlier with a TE of 9.5% due to significant allocations to overseas equities.
Based on these charts, we could group funds into ‘low TE’ of 2-5% and ‘high TE’ of 5-8%. Equity large cap funds tend to be all low TE, while there is a bit more variability in the other segments.
How skilled are Indian equity funds – segmenting by IR
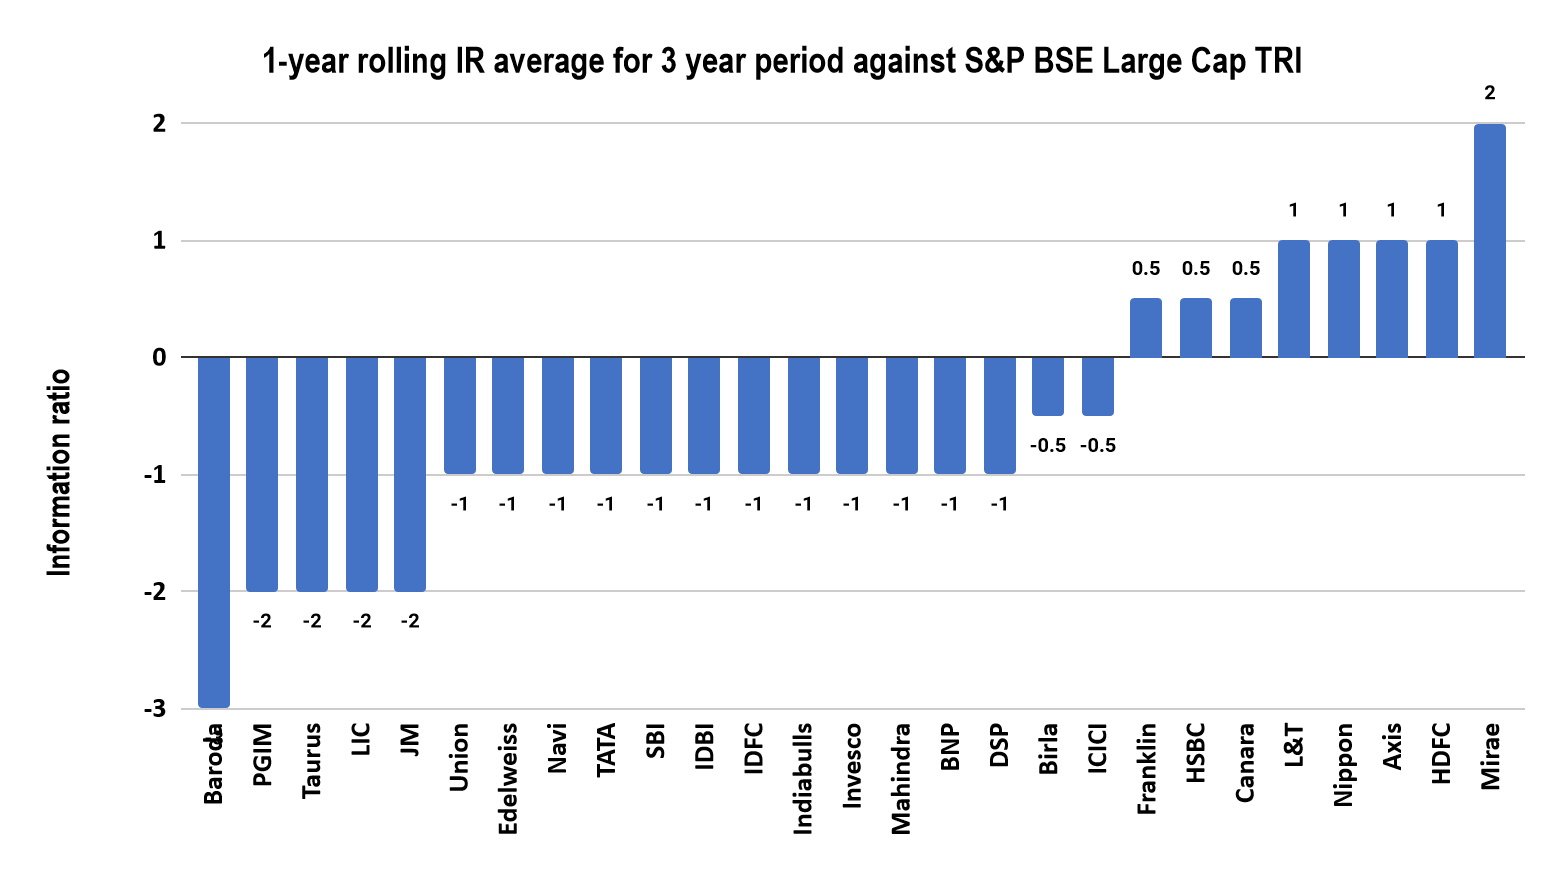
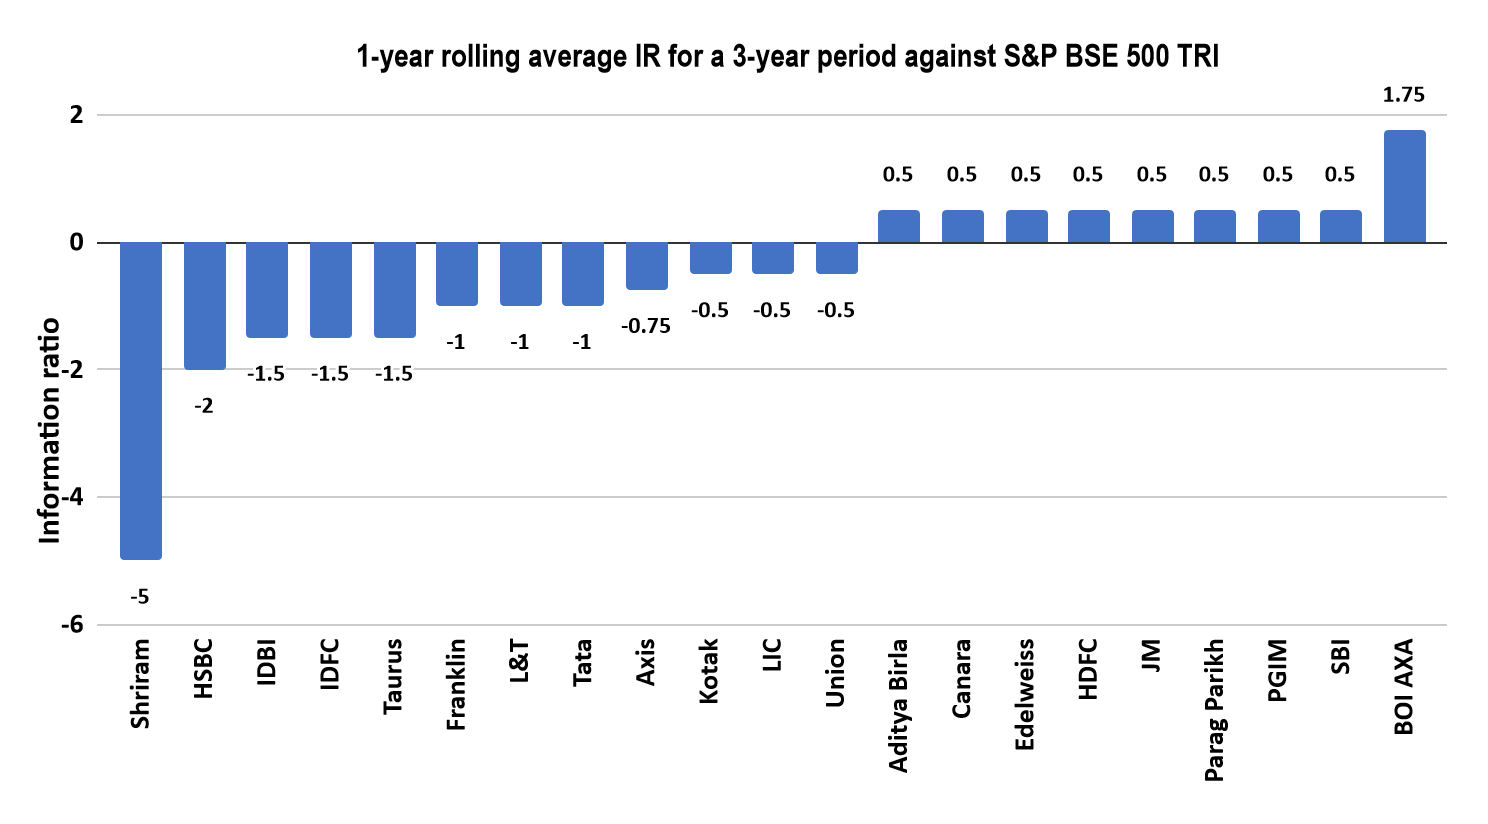
Similar to the TE chart, we used MMI’s Quant Tool to chart IR over time, as per the chart below –

We calculated 1 year rolling IR for Indian equity funds over 3 years ending December 2021 and then calculated the average of their IR over this 3 year period
Equity large cap funds showed a wide range of IR from -3 to 2.
Equity mid cap funds showed average IRs of -1.05 to 2.57.

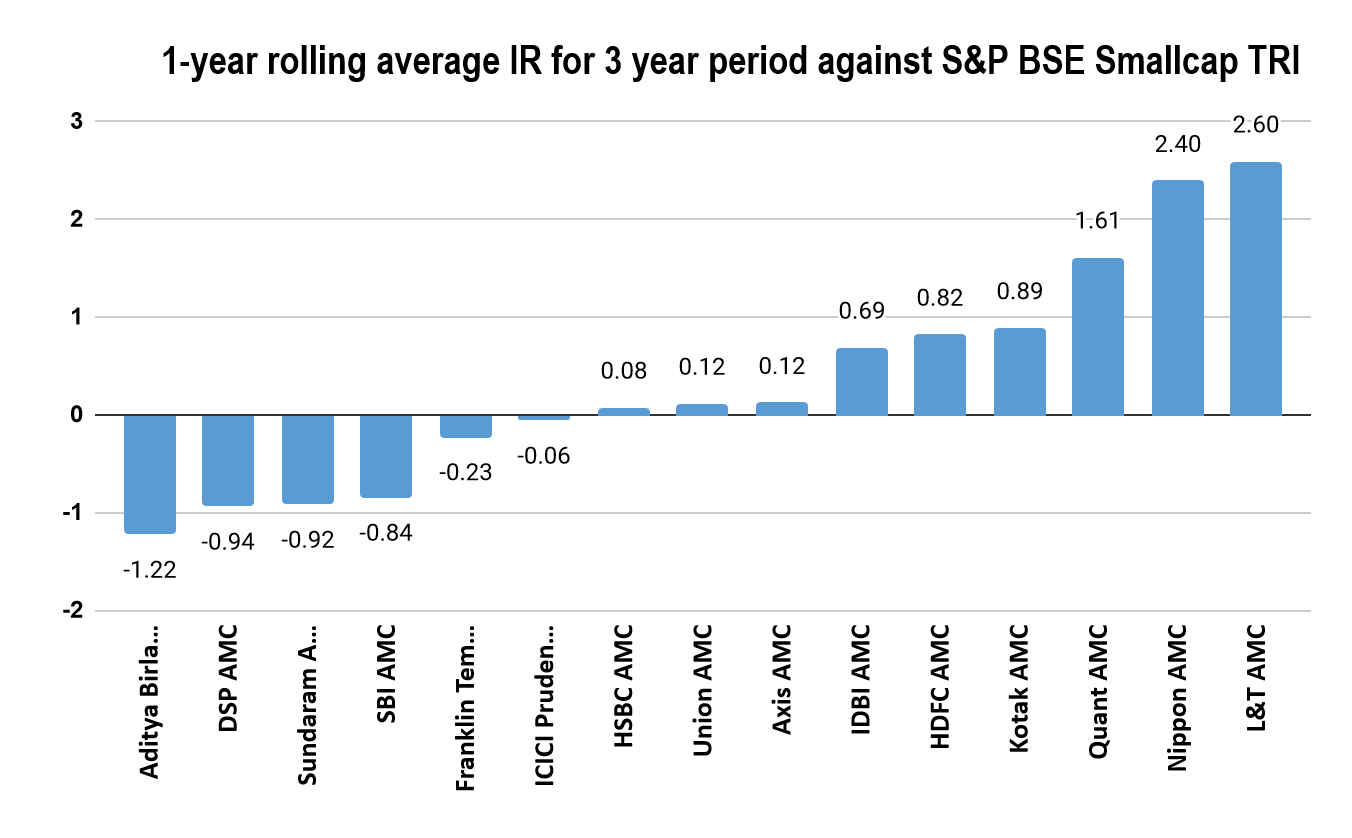
Equity small cap funds had average IRs of -1.22 to 2.6.
The equity flex cap funds segment had many more funds with negative IRs; the range was -5 to 1.75.
Do higher TEs result in higher IRs?
Very low TEs for active funds indicate ‘closet indexers’. So higher TEs show that at least the funds are trying to take active bets. However, higher TEs don’t necessarily lead to higher IRs. Some studies suggest that emerging market equity managers maximise IRs in the 6-12% TE range with the best results at the low and high end.
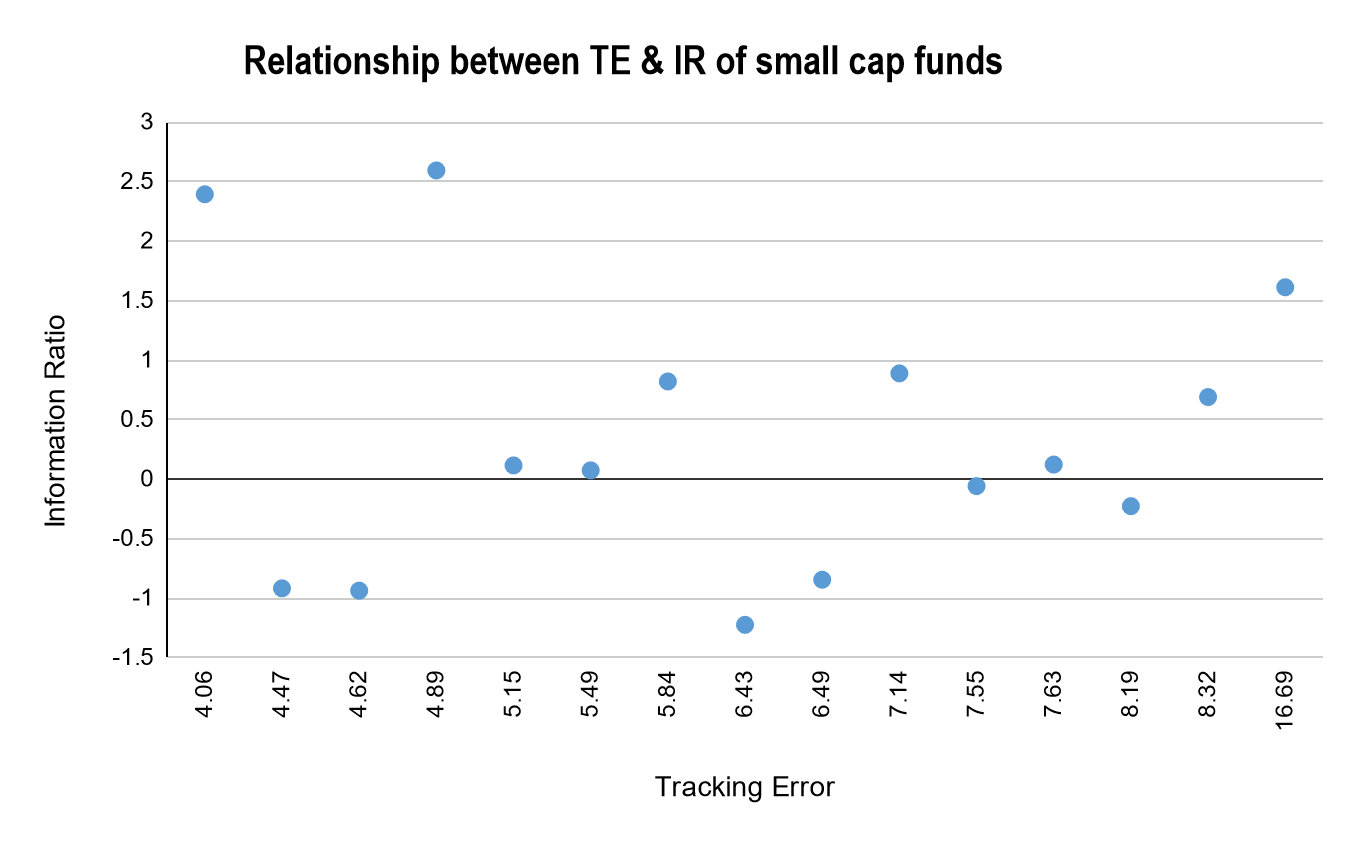
To see a visible relationship between the TE and IR, we plotted the average IR against the average TE of the funds. We understand that the use of averages might ‘smoothen’ the results, so in future we will attempt to do this with non-smoothened data set. Nevertheless, our observations were interesting starting points for further analysis.
We observed no relationship between the TE and IR for large cap funds.

In the case of mid cap funds, we detected a visible positive relationship – the higher the TE, the higher the IR.

Small cap funds did not show a visible correlation.
Neither did the flexi-cap funds.

Overall, we didn’t see a visible relationship between TE and IR so we don’t recommend judging active funds on TE alone.
Conclusion
- For evaluating funds, Information Ratio (IR) is a better tool than Sharpe Ratio (SR) as it measures relative performance against the appropriate benchmark.
- TE can be used to eliminate ‘closet indexers’. Indian equity funds can be grouped into ‘low TE’ of 2-5% and ‘high TE’ of 5-8%. Equity large cap funds tend to be all low TE, while there is a bit more variability in the other segments.
- Indian equity funds show a wide range of IR ranges from hugely negative to positive. We need to do further analysis on the stability, and hence, predictive powers of the IR measure in India.
- We did not see a visible relationship between TE and IR, except in the mid-cap funds. We need to do further research on this aspect too.
Prepared by – Devasri Davey, Charles Mathew, Amit Soni, Revant Sharma, Rahul Sharma. (This project was done as part of a short internship in June 2022).
References –
https://seekingalpha.com/article/63911-clarifying-the-information-ratio-and-sharpe-ratio


You must be logged in to post a comment.