INF179KC1BS5
Overall analysis
1-yr rolling excess returns of the fund is constant. This fund’s TE has declined- but it has moderate TE, IR is moderate. The fund gave the maximum return in comparison to its peers as it is tackling around the maximum line. It has negative risk and positive returns which means the fund is taking least risk to generate returns.
Performance analysis
Rolling returns – 1 year rolling excess returns
Snail trail – 1 year rolling excess risk/return
Tracking error – 1yr rolling tracking error
Information ratio – 1yr rolling information ratio
Rolling returns in quartiles
The rolling return chart shows excess 1Y-year rolling return in context of peer return quartiles. The blue line’s time above the third green median line indicates the fund’s better than median performance.
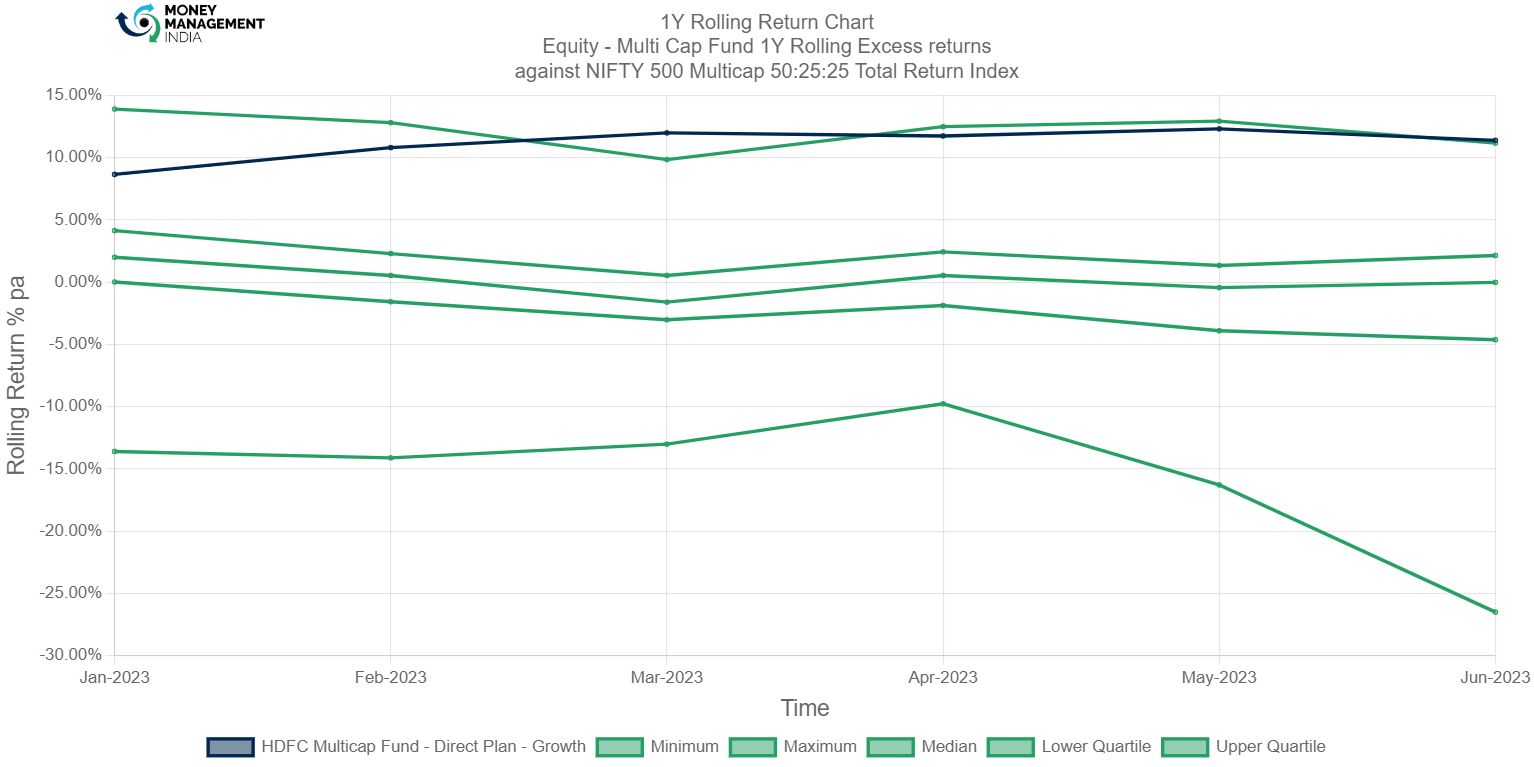
The 1 year rolling excess return chart shows that the fund is performing well against its benchmark index, it is generating returns around maximum (green) line. It has exceeded the maximum in March 2023 by achieving the highest returns around 12%, & in the recent month of June it has generated returns of 11.39% which is again beyond the maximum line.
Rolling risk/return (Snail-trail)
The rolling risk/return chart shows excess 1-year annualized returns relative to the index. The top left quadrant would indicate higher returns with lower volatility than index.

The snail trail chart shows that the fund performance is great, the fund has almost generated positive 1 year rolling returns by taking negative risk, It generated peak 1 year rolling excess return of 12.3% by taking the negative risk of -0.4%.
Tracking error
The tracking error chart shows how the fund ‘tracks’ against the index. The higher the TE, the more active the fund’s return has been, with the 1-3% range considered to be low TE, 3-6% range considered to be moderately active and anything higher than 6% is high TE. Funds with TE of less than 2% can be considered to be closet indexers.

1 year rolling tracking error shows that the fund is moderately active & has the current TE of 2.4%. In February 2023 it touched the high of 3%, & further it dropped.
Information ratio
The information ratio is a measure of ‘risk-adjusted return’ as it’s the excess return per unit of excess volatility. Active funds should have IR of higher than 1, ideally higher than 1.3 at least to indicate skill.

Information ratio of this fund is decent enough, currently standing at 4.7, Fund is ideal to active & had touched the highest 1 year rolling information ratio of 5 .
Portfolio analysis
Stock style chart
Morningstar’s stock style chart shows the ‘style’ of the stocks in the portfolio in terms of size and value/growth style. The centroid shows the weighted average while the zone circle shows how varied the stock styles are.

The centroid indicator of this fund states that the fund has the large cap- growth stocks & they also have a couple of blended stocks added to its portfolio, whereas its ownership zone indicator indicates that the fund manager sometimes put-on mid & small cap’s stocks of all the three categories i.e., value, blended & growth. The multi-cap (yellow) indicator doesn’t have its footprints around small cap; which means the peer mid-cap funds doesn’t add-up small cap stocks into their portfolios.
Factor profile chart
Morningstar’s factor profile shows the historical style analysis of the stocks in the portfolio in terms of size, value/growth style and other key factors. The blue circle shows the fund relative to the black dot for the category average.
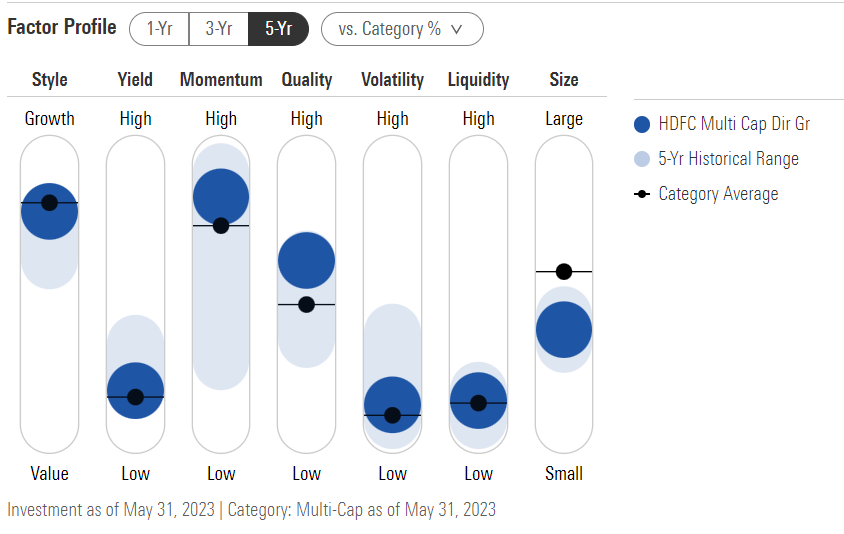
Factor profile chart of this fund shows that the returns (yield) of the portfolio is quite low, Volatility & Liquidity of the stocks present in the portfolio are low; category average indicator is around the fund’s indicator. Stocks traded in the portfolio come under growth oriented class, momentum of this portfolio has fluctuated from low to high as shown by 5 years historical range.Quality is improvising as compared to its categories, size indicator points-out that it has a small portfolio as compared to its peer comparison.
Prepared by – Hemanth Reddy, August 2023
You must be logged in to post a comment.