Performance analysis
Rolling returns in quartiles
The 3 year excess rolling returns are negative across the corporate bond. The blue line is mostly in the 2nd/3rd quartile.

The fund did not show any major changes overall during the period. The fund was between -0.5 to +0.5 for the entire period.
Rolling risk/return (Snail-trail)
The standard deviation on the 3 year excess returns range between -1% to 3%. overall there is high volatility in the fund.

The fund always had high risk of around 2 – 3% and returns were positive but as of May 2023, the returns are negative of almost -0.4 %.
Tracking error
The tracking error ranges between 0 to 2

The TE was at its peak in April 2021 with around 1.7 % and later it gradually decreased to 0.6%. The TE of the fund was almost stable for almost a year, having TE 0.8%.
Information ratio
The information ratio ranges between 0 to -3.5. The overall ratio has been mostly below 0.
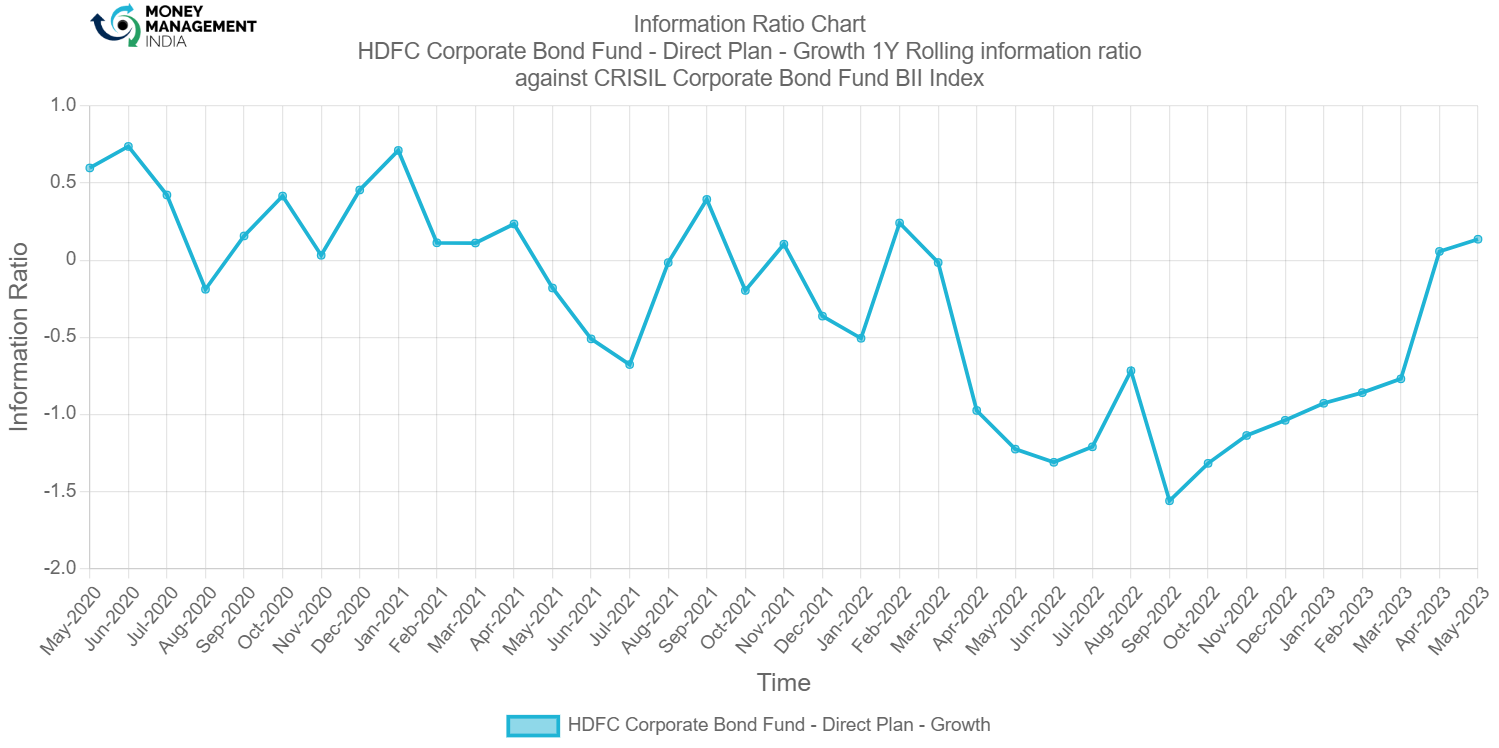
The IR was always between -1 and +1 from May 2020 to April 2022. Then it further decreased for the months and later rose to 0.15 % in May 2023.
Prepared by – Ganesh Hulke
You must be logged in to post a comment.