INF754K01ML4
Overall analysis
1-yr rolling excess returns of the fund has declined, Overall, TE is between 5-13 which means the fund is ideally active. IR has gone through both positive and negative phase. As of now the fund has high TE of 9.7% & negative IR of -0.7.
Performance analysis
Rolling returns – 3 year rolling returns over 5 years
Snail trail – 3 years rolling returns over 5 years
Tracking error – 1 years rolling tracking error
Information ratio – 1 year rolling information ratio
Rolling returns in quartiles
The rolling return chart shows excess 1Y-year rolling return in context of peer return quartiles. The blue line’s time above the third green median line indicates the fund’s better than median performance.
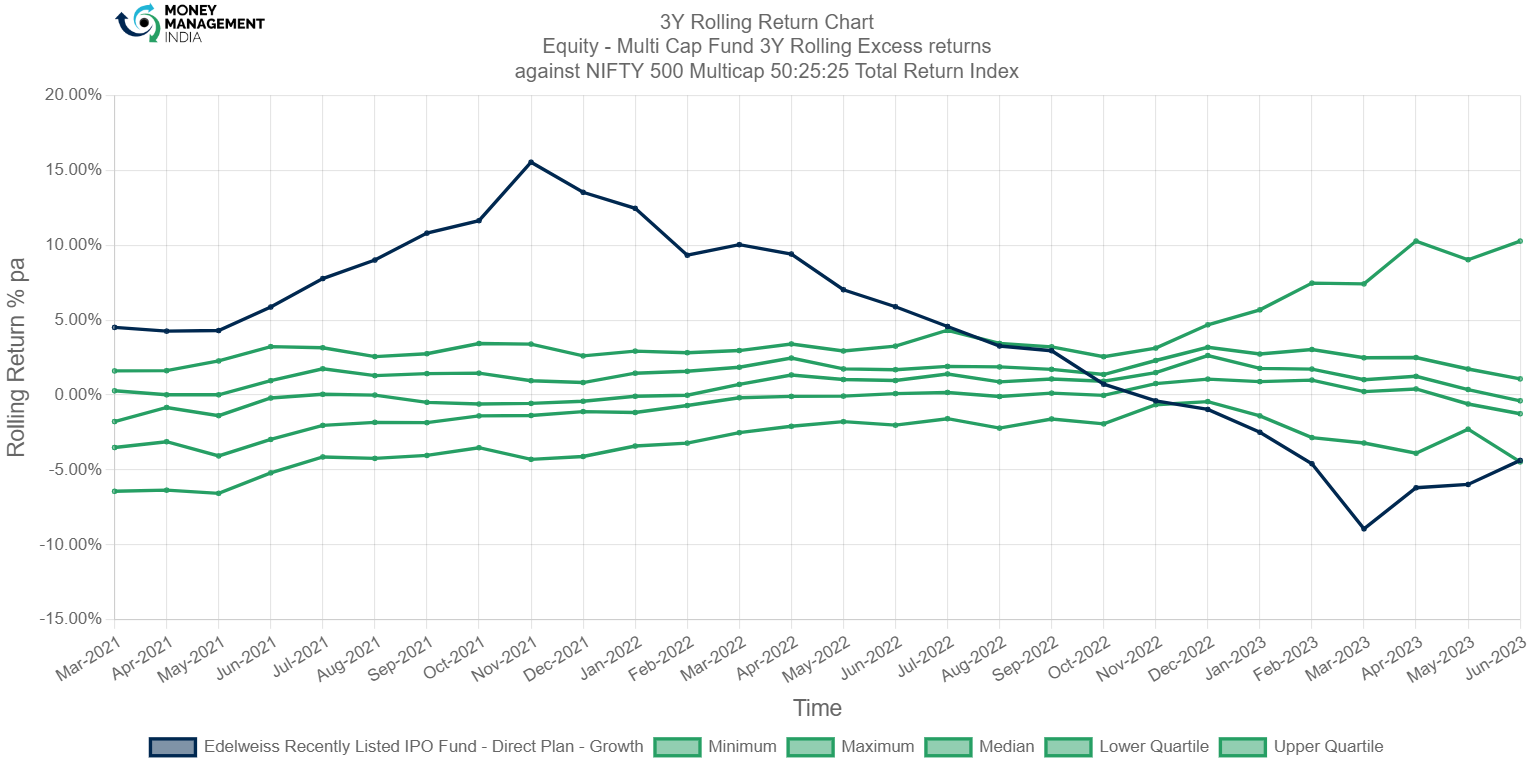
The fund performed well in it’s past by exceeding the benchmark by 15.5% on November 2021, it was generating returns more than its peers. After August 2022 the fund’s 3 years rolling excess returns started falling, and fell up to -8.9%. Currently the fund stands at -4.36%, passing above the minimum line. It seems like fund is trying to get over the negative returns.
Rolling risk/return (Snail-trail)
The rolling risk/return chart shows excess 1-year annualized returns relative to the index. The top left quadrant would indicate higher returns with lower volatility than index.

3 years rolling excess risk/return shows that, as of now the fund is taking ample risk & not delivering expected performance by generating negative returns (risk: 1.7% & return of: -4.3%). In past the fund’s performance was opposite to the current scenario it generated more & positive returns from March 2021 to October 2022), November 2021 it generated highest return of 15.5% by taking the negative risk of -2.4%
Tracking error
The tracking error chart shows how the fund ‘tracks’ against the index. The higher the TE, the more active the fund’s return has been, with the 1-3% range considered to be low TE, 3-6% range considered to be moderately active and anything higher than 6% is high TE. Funds with TE of less than 2% can be considered to be closet indexers.
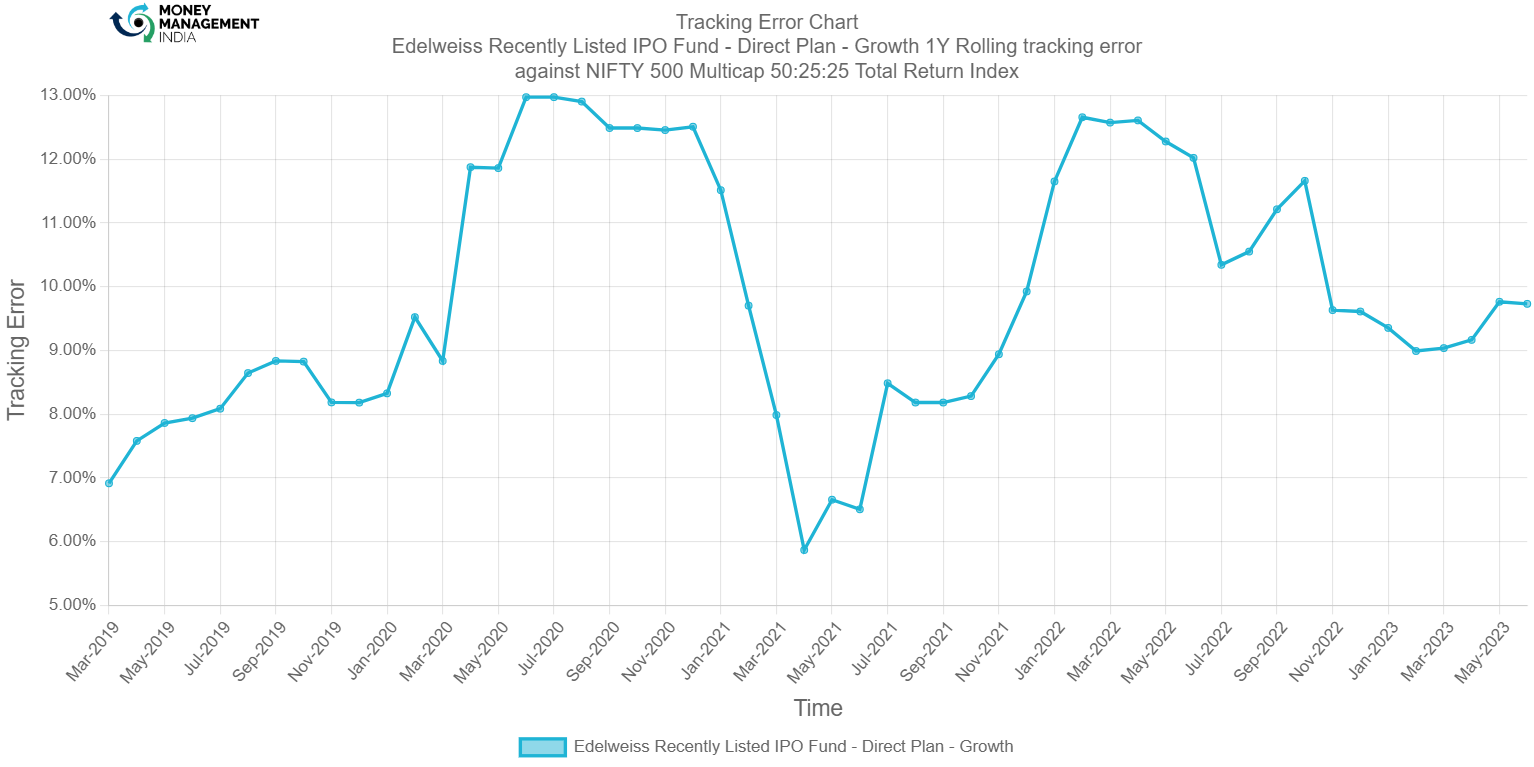
1 year rolling Tracking error chart shows that the fund’s overall TE is above 5.8%, with the high of 12.98%, which states that the fund is highly active & aggressively active at sometimes. Between June 2020-July 2020 the fund was at its peak TE levels.
Information ratio
The information ratio is a measure of ‘risk-adjusted return’ as it’s the excess return per unit of excess volatility. Active funds should have IR of higher than 1, ideally higher than 1.3 at least to indicate skill.

Started with the negative information ratio of -1.9, hiked till 2.8, again turned into negative on May-2023, It concludes that the portfolio is not giving risk-adjusted returns frequently.
Prepared by – Hemanth Reddy, August 2023
You must be logged in to post a comment.