ISIN INF209K01VH8
Overall Analysis
The snail trail analysis shows that the rolling return is continuously in line with the median. The fund did outperform the index, but the median performed better in recent times. The passive approach did lower the tracking error which has resulted in higher IR.
Performance Analysis
Rolling Returns in quartiles
The rolling return chart shows excess 3-year annualized returns in the context of peer return quartiles. The blue line’s time above the third green median line indicates the fund’s better than the median performance of the benchmark.
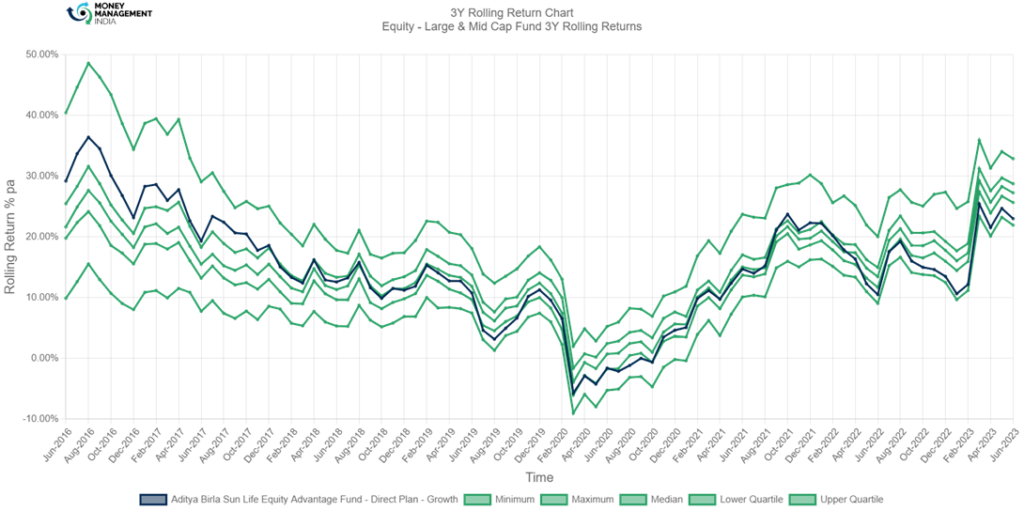
The performance (blue line) closely aligns with the median throughout the period. There are points where the fund has outperformed and underperformed the median. Performance also outperformed the upper quartile line, but now currently settles below the lower quartile of the performance spectrum.
Rolling Risk/return (snail-trail)
The rolling risk/return chart shows excess 3-year annualized returns relative to the index. The top left quadrant would indicate higher returns with lower volatility than the index.
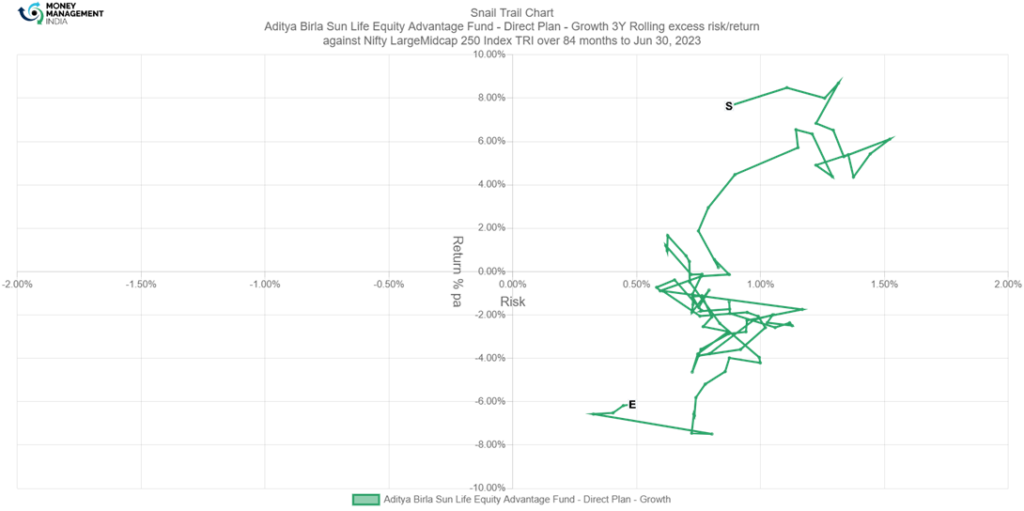
This extremely volatile active fund has shown its performance in both high and low-risk quartiles. It started outperforming the index; the active management strategy has led the fund to underperformance with the high-risk quartile. In March 2022, their performance started deteriorating, and still struggle to recover.
Tracking Error
The tracking error chart shows how the fund ‘tracks’ against the index. The higher the TE, the more active the fund’s return has been, with the 2-4% range considered to be barely active, the 4-6% range considered to be reasonably active, and anything higher attributed to concentrated/focused funds. Funds with TE of less than 2% can be considered to be closet indexers.
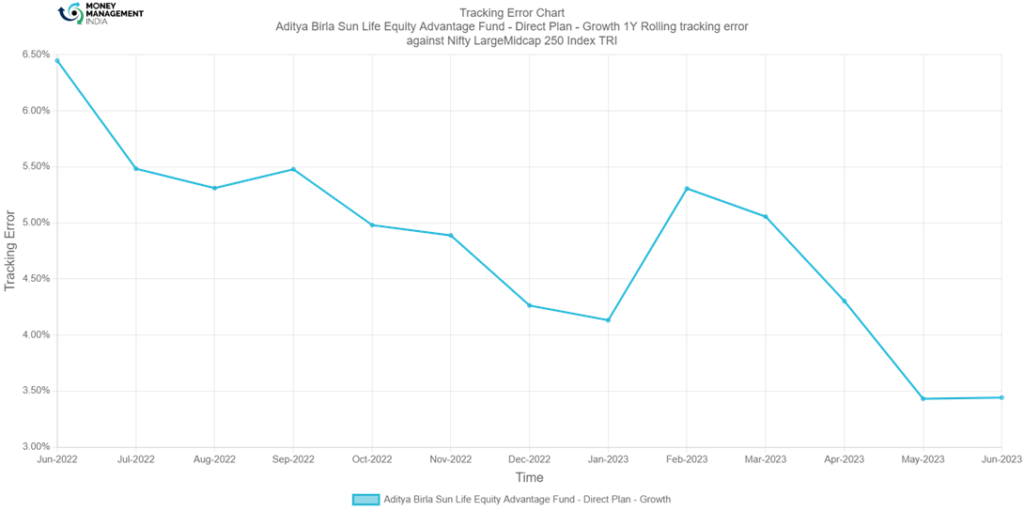
Low tracking error indicates that the fund is following a passive approach to the index. The fund tried to be active on certain levels which are shown with the increase in TE. Currently, the TE stays at 3.441%
Information Ratio
The information ratio is a measure of risk-adjusted return as its excess return per excess unit of volatility. Active funds must have an IR higher than 1, higher than 1.3 is considered ideal.
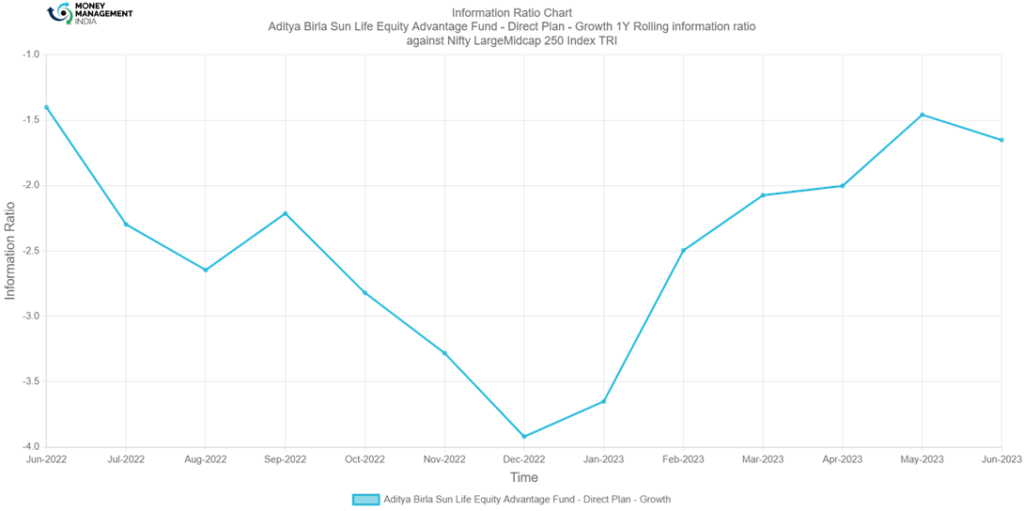
The increase in TE has caused the low levels of IR in Dec 2022. The positive slope in the chart from Jan 2023 till early May 2023 indicates the fund had a good run. The fund did manage to beat the benchmark in certain periods. A drop in the IR in Jun 2023, indicates the management of the fund deviated from its benchmark.
Portfolio analysis
Stock style chart
Morningstar’s stock style chart shows the ‘style’ of the stocks in the portfolio in terms of size and value/growth style. The centroid shows the weighted average while the zone circle shows how varied the stock styles are.
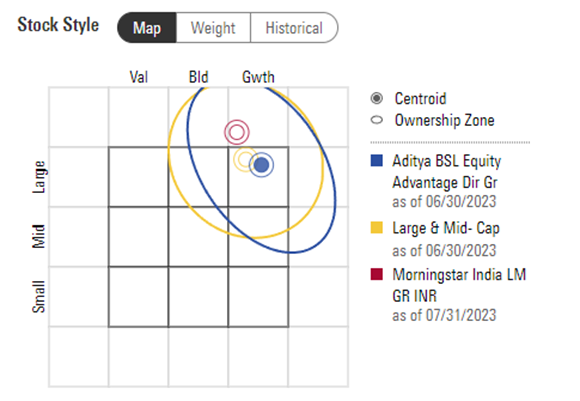
The fund covers most of the large & mid-cap index and is predominantly focused on growth and blend securities. Ownership is mostly in growth stocks as the name suggests, and the fund has no other investments apart from it, except cash and equivalents.
Factor profile chart
Morningstar’s factor profile shows the historical style analysis of the stocks in the portfolio in terms of size, value/growth style, and other key factors. The blue circle shows the fund relative to the black dot for the category average.
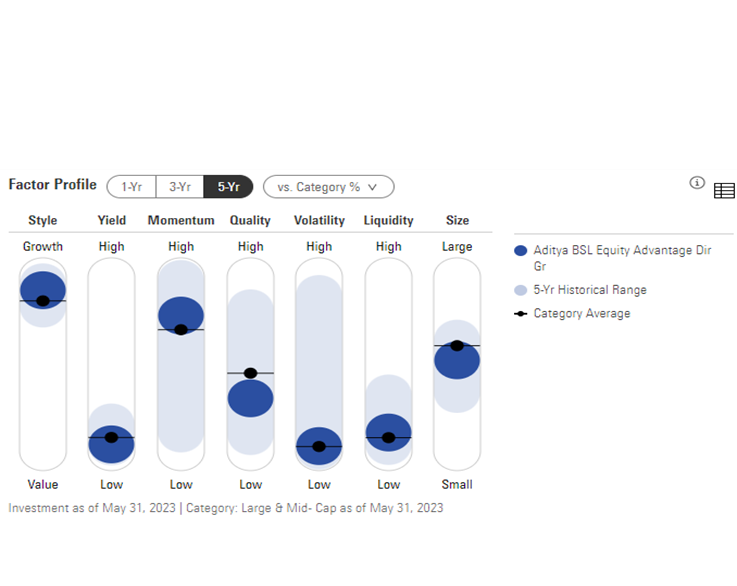
Since the fund is “capital appreciation” focused, a higher exposure can be seen in the growth part. Yield is lowered to the bare minimum indicating lower yield, and the fund performed moderately better as indicated by its momentum. The profitability and low leverage have lowered the quality aspect of the fund. With lower volatility and lower liquidity the fund’s performance indicates it is a choice for growth oriented investors.
Prepared by Sai Mahesh, August 2023
You must be logged in to post a comment.