Performance analysis
Rolling returns in quartiles
The 3 year excess rolling returns are negative across the corporate bond. The blue line is mostly in the 2nd/3rd quartile.
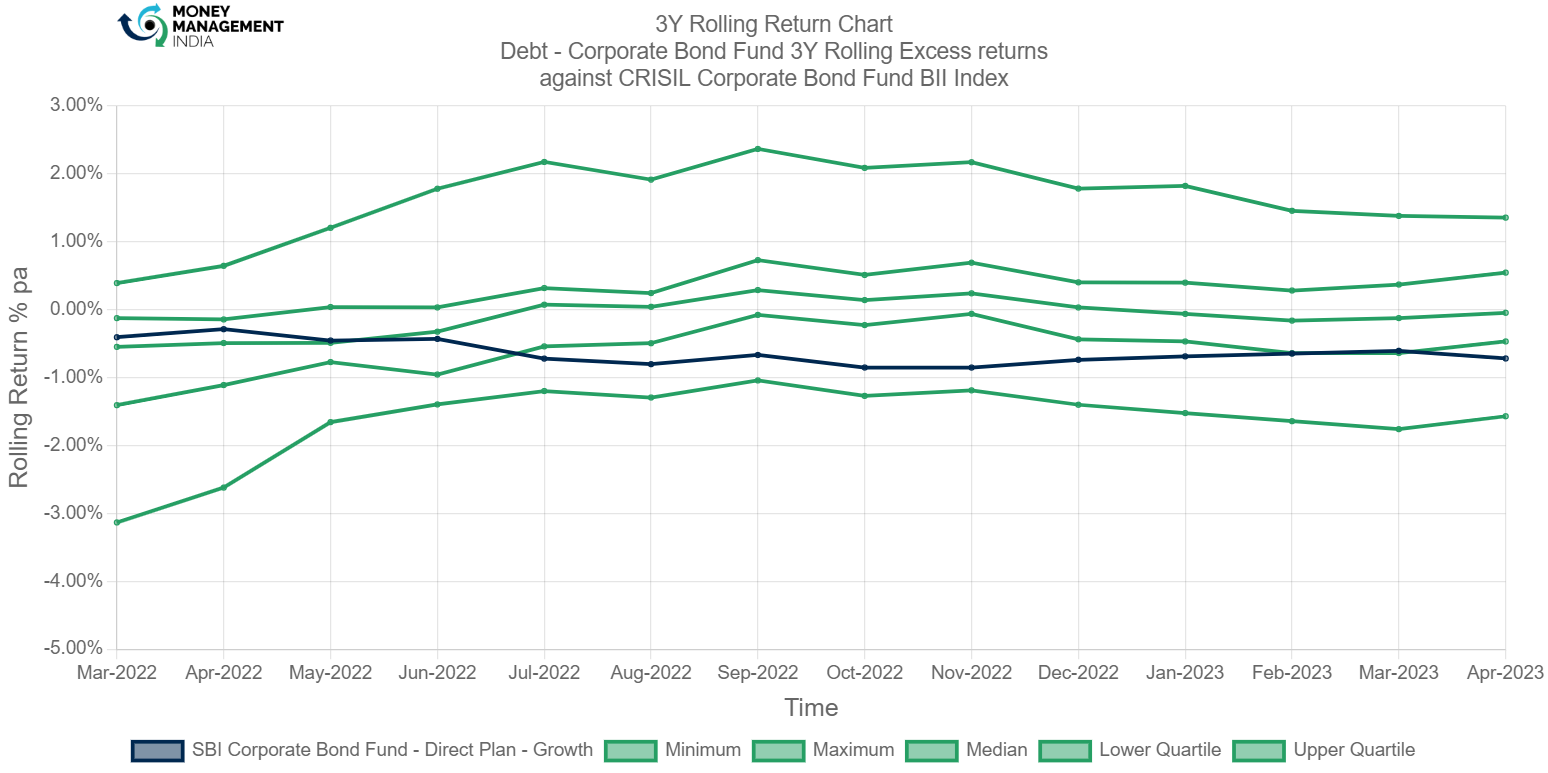
The rolling returns here are for only one year. The fund is underperforming. The fund is now in the 4th quartile.
Rolling risk/return (Snail-trail)
The standard deviation on the 3 year excess returns range between -1% to 3%. overall there is high volatility in the fund.
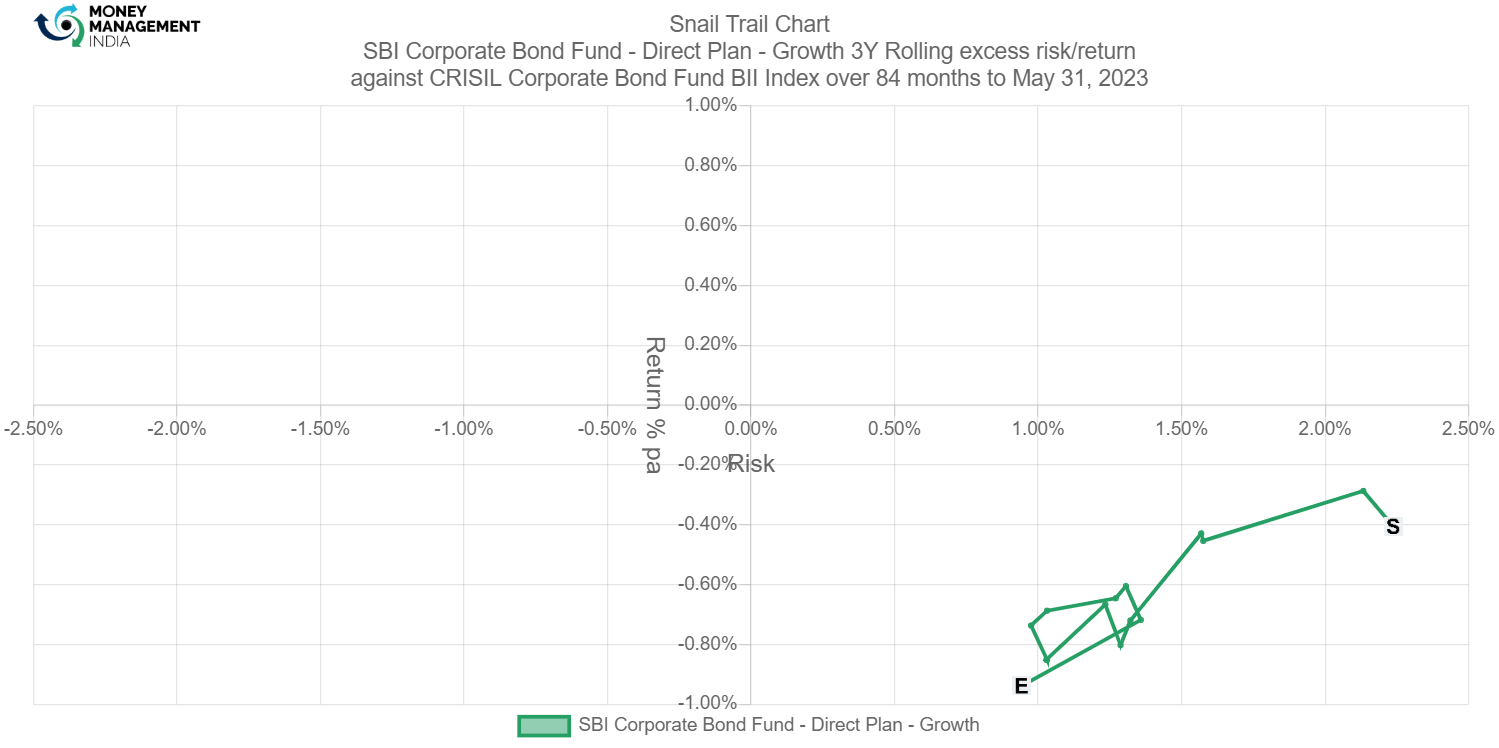
The fund when started generated negative returns and had a risk of 2.2%. At the end the fund is now generating a return of -0.8% and having a risk of almost 1%.
Tracking error
The tracking error ranges between 0 to 2

The TE of this fund was at its peak at around 1.5% in Aug 2020. Then later for the entire period the TE gradually decreased. As of May 2023, the TE is now at 0.4%.
Information ratio
The information ratio ranges between 0 to -3.5. The overall ratio has been mostly below 0.
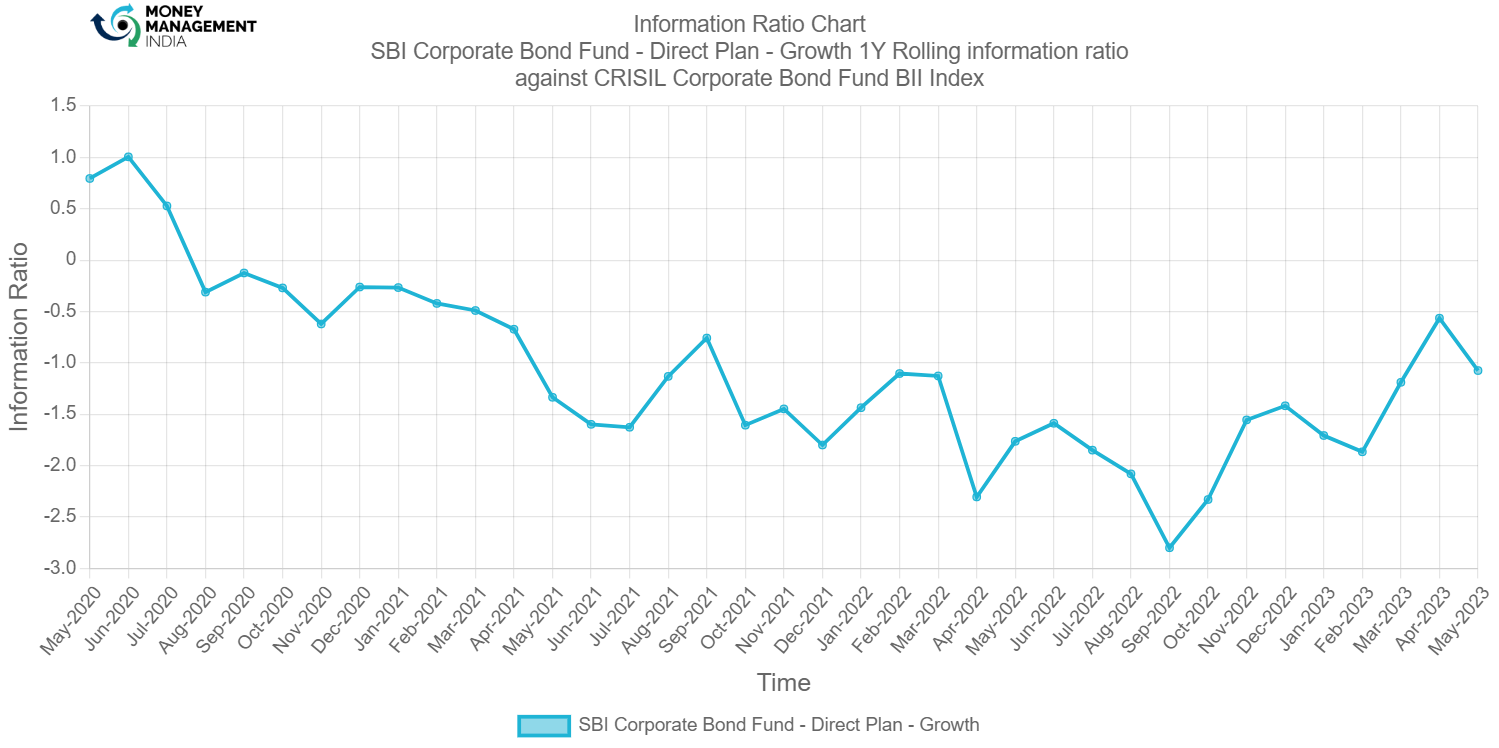
The IR was at its peak at 1 in the month of June 2020. As of May 2023, the IR is at -1.1. The IR is always negative from Aug 2020.
Prepared by – Ganesh Hulke
You must be logged in to post a comment.