ISIN INF846K010C0
Overall analysis
The 1-yr rolling excess returns shows the fund performed with lower risk, fund is moderately active according to TE. IR shows that the fund returned less risk-adjusted returns
Performance analysis
Rolling returns in quartiles
The rolling return chart shows excess 1-year annualised returns in context of peer return quartiles. The blue line’s time above the third green median line indicates the fund’s better than median performance.

.
The 3Y rolling return of the fund shows that it was underperforming in the negative section from the start, with -3.7% as the lowest on Dec 2022.The fund has been actively outperforming the benchmark since Jan 2023 with the highest returns of 9.4% in May 2023.
Rolling risk/return (Snail-trail)
The rolling risk/return chart shows excess 1-year annualised returns relative to the index. The top left quadrant would indicate higher returns with lower volatility than index.
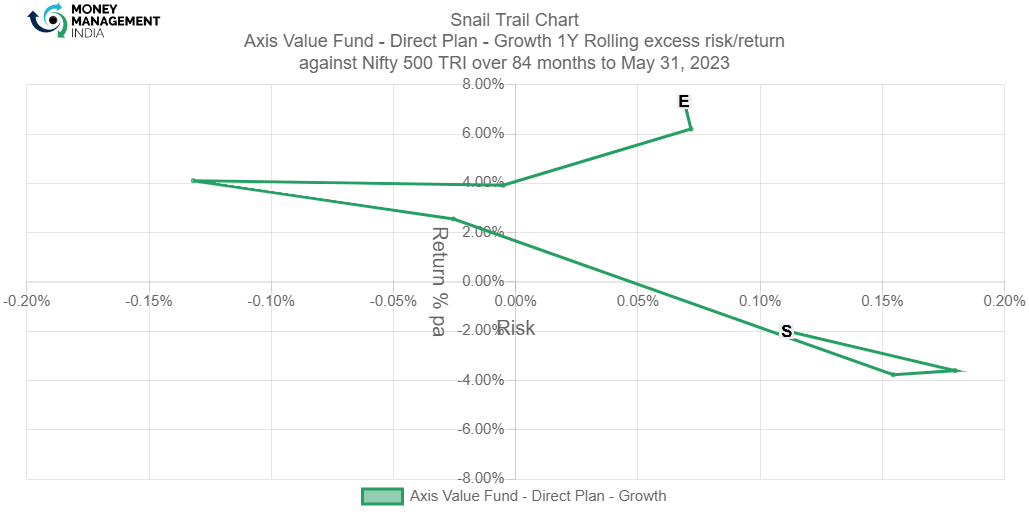
This fund has shown impressive 1-year excess returns, touching 4% per annum and a significant time around the 2-6% pa, whilst lower than index volatility of -2-2% pa. However, the excess return went up to around 2% towards the end of Apr 2023.
Tracking error
The tracking error chart shows how the fund ‘tracks’ against the index. The higher the TE, the more active the fund’s return has been, with the 2-4% range considered to be barely active, 4-6% range considered to be reasonably active and anything higher attributed to concentrated/focused funds. Funds with TE of less than 2% can be considered to be closet indexers.

Information ratio
The information ratio is a measure of ‘risk-adjusted return’ as it’s the excess return per unit of excess volatility. Active funds should have IR of higher than 1, ideally higher than 1.3 at least to indicate skill.

The Information ratio of the fund is less than -1% in the start. It gradually started to increase to 0.5% from Jan 2023 and has been consistently inclining to more than 1%, which indicates that the fund is performing well.
Portfolio analysis
Stock style chart
Morningstar’s stock style chart shows the ‘style’ of the stocks in the portfolio in terms of size and value/growth style. The centroid shows the weighted average while the zone circle shows how varied the stock styles are.

The stock style of the fund shows that the weighted average is slightly different from the category average. The ownership zone lies in the Large cap of growth and blend. Mid cap growth and blend can also be seen. No consideration is given to small cap stocks..
Factor profile chart
Morningstar’s factor profile shows the historical style analysis of the stocks in the portfolio in terms of size, value/growth style and other key factors. The blue circle shows the fund relative to the black dot for the category average.

The factor profile shows that the fund’s style is closer to blend-growth oriented, its exposure is more than the category average. The yield section is below the category average but assets have grown significantly than the category average. The profitability is lower than the category average, but does have reasonable historical range. The volatility of the fund is very low and the liquidity is low. The market capitalization of the category average is around the mid cap section.
Prepared by – Ayushi Shervegar, August 2023
You must be logged in to post a comment.