ISIN CODE INF582M01GI3
Overall analysis
3-yr rolling excess returns is in the range of -7-8% and tracking error against benchmarks have been in the 5-10% range which is good overall; but the funds’ performance in the short run has been deteriorating. The fund has given the maximum excess return in comparison to its peers; but has dropped to below the third line (median) over the past 7 months.
Performance analysis
Rolling returns in quartiles
The rolling return chart shows excess 3-year annualised returns in context of peer return quartiles. The blue line’s time above the third green median line indicates the fund’s better than median performance.
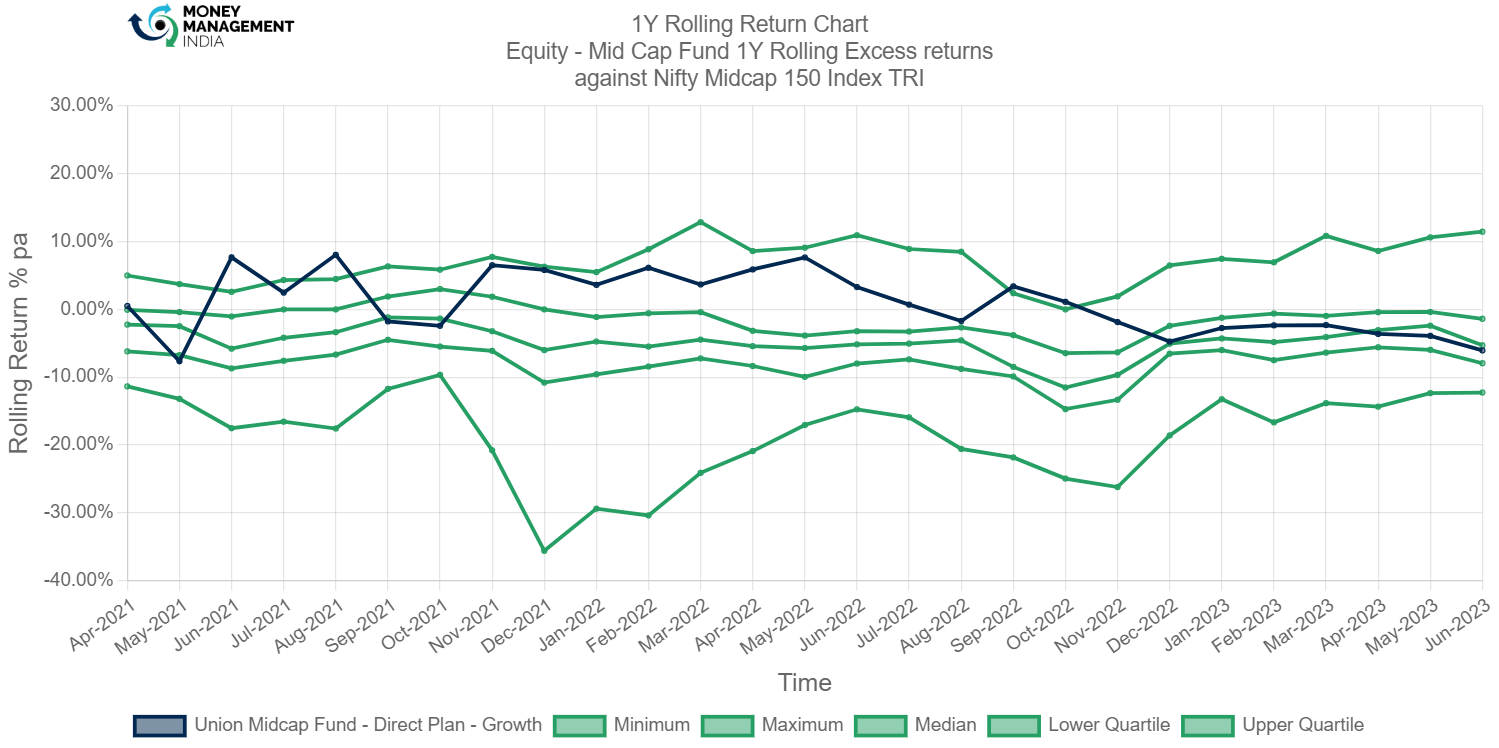
The rolling return of the fund was originally low, but from June 2021, it surpassed the third green median line. However, after April 2023, it started to decline. The maximum rolling return is 8.5% and the minimum rolling return is -7.64%.
Rolling risk/return (Snail-trail)
The rolling risk/return chart shows excess 3-year annualised returns relative to the index. The top left quadrant would indicate higher returns with lower volatility than index.
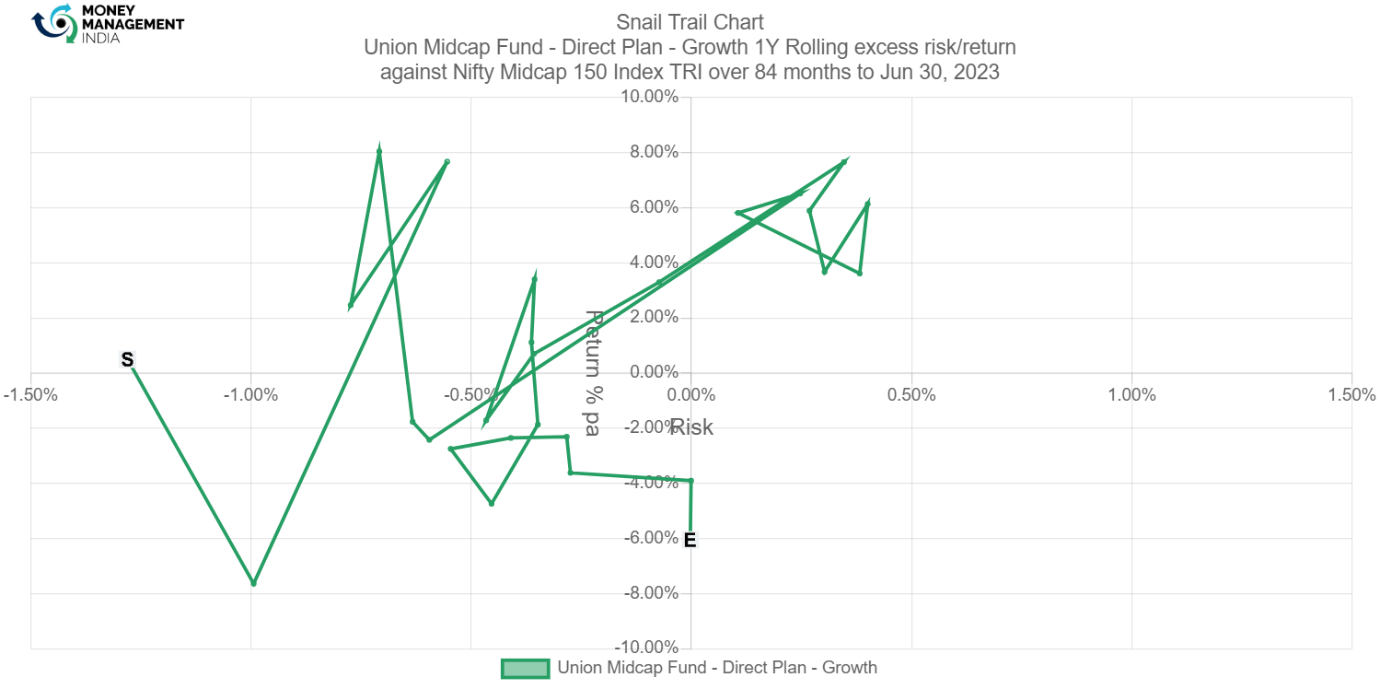
The fund originally underperformed the benchmark while carrying a comparatively lower risk, but after June 2021 it outperformed the benchmark while carrying a relatively higher risk, then after November 2021 it exceeded the benchmark while carrying a relatively lower risk, and at the end it fell exactly between the bottom right and left quadrants.
Tracking error
The tracking error chart shows how the fund ‘tracks’ against the index. The higher the TE, the more active the fund’s return has been, with the 2-4% range considered to be barely active, 4-6% range considered to be reasonably active and anything higher attributed to concentrated/focused funds. Funds with TE of less than 2% can be considered to be closet indexers.
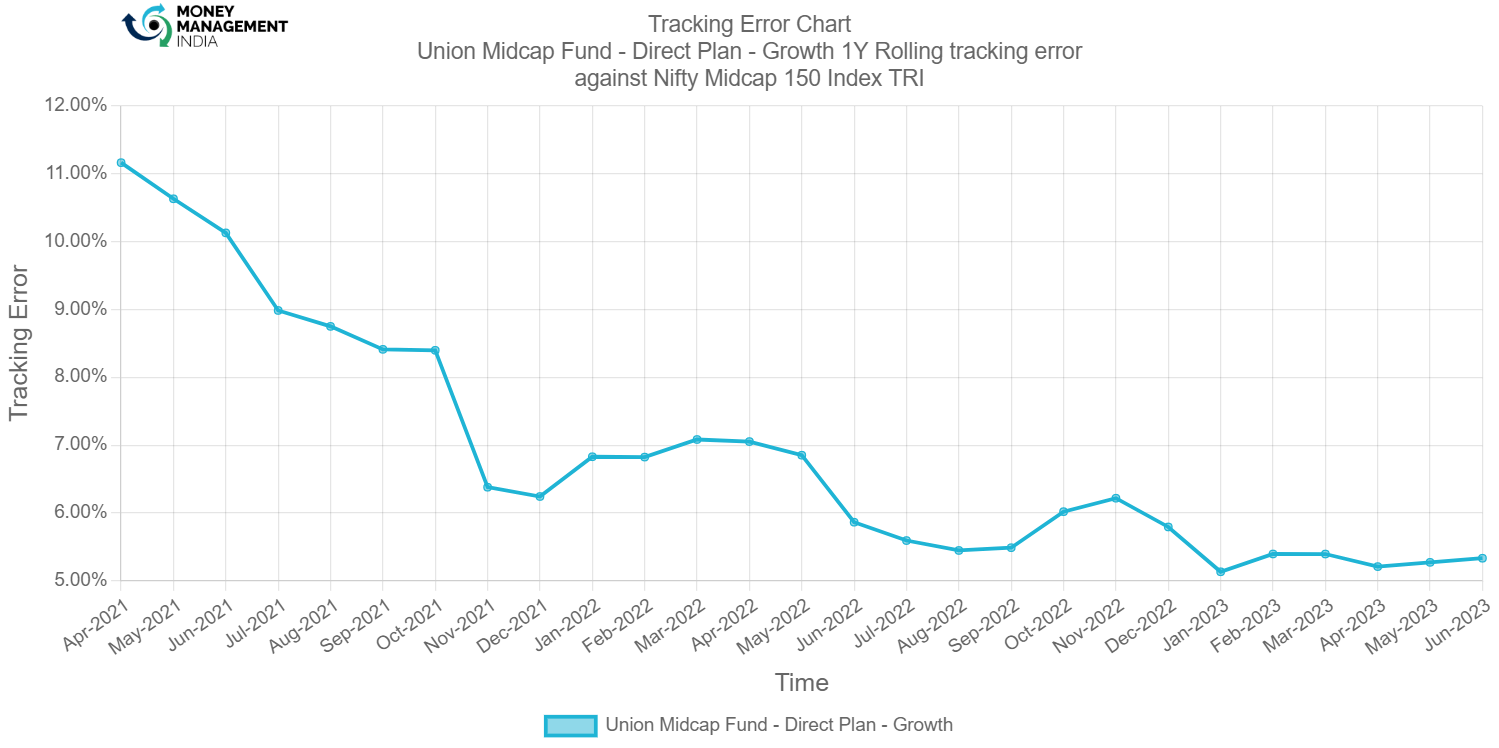
The fund’s tracking error originally exceeded 6%, which is good, but after December 2022 it declined to a range between 4-6%, which is regarded as a reasonable active range.
Information ratio
The information ratio is a measure of ‘risk-adjusted return’ as it’s the excess return per unit of excess volatility. Active funds should have IR of higher than 1, ideally higher than 1.3 at least to indicate skill.
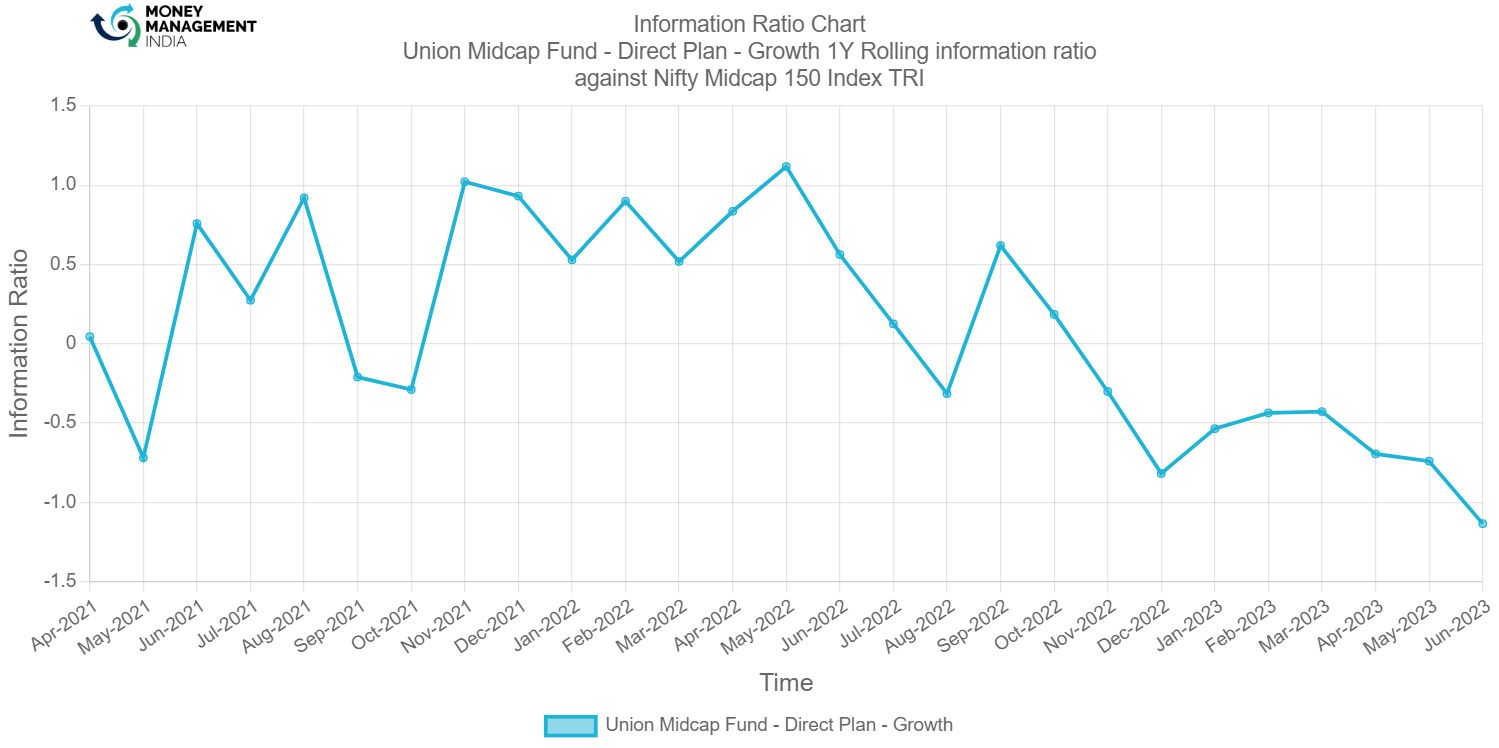
The fund’s information ratio started off low and has only been twice above 1, which is not ideal. It currently stands at -1.1.
Portfolio analysis
Stock style chart
Morningstar’s stock style chart shows the ‘style’ of the stocks in the portfolio in terms of size and value/growth style. The centroid shows the weighted average while the zone circle shows how varied the stock styles are.
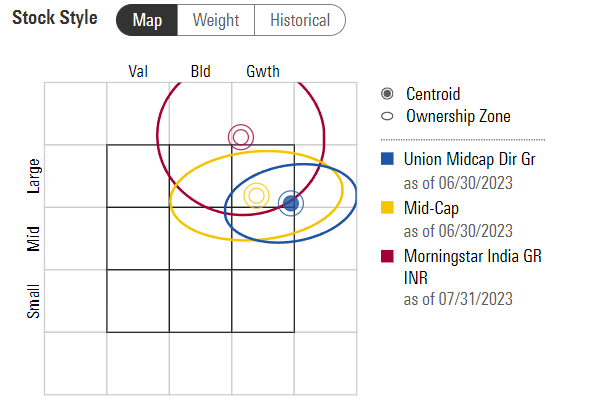
The stock style chart shows that the fund is typically a Large Cap growth fund.
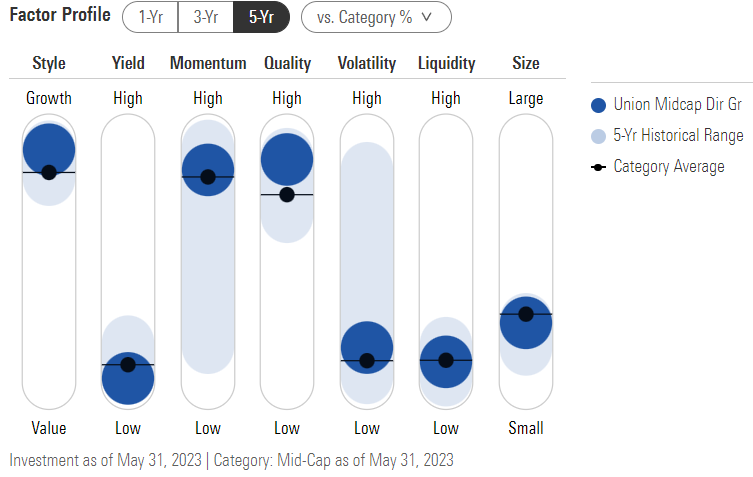
Factor profile chart
Morningstar’s factor profile shows the historical style analysis of the stocks in the portfolio in terms of size, value/growth style and other key factors. The blue circle shows the fund relative to the black dot for the category average.
Prepared by Bhavesh Mahajan, Aug 2023.
You must be logged in to post a comment.