ISIN
Performance analysis
Rolling returns in quartiles
The 3-year rolling excess median return has gradually come down from around 4% from May 2016 to -1.77% in April 2023. The dispersion between upper and lower quartile is still wide at +12.43% and -7.78% pa.

The fund has generated negative excess returns during the period between May 2016 – April 2023. The blue line’s time below the median line indicates that the fund has underperformed the performance of the median. However, the fund started with positive returns at 5% per annum in May 2016 but kept declining over the years.
Rolling risk/return (Snail-trail)
Funds in this category have shown slightly higher (-3.5 to +7) standard deviation compared to the volatility of the index.
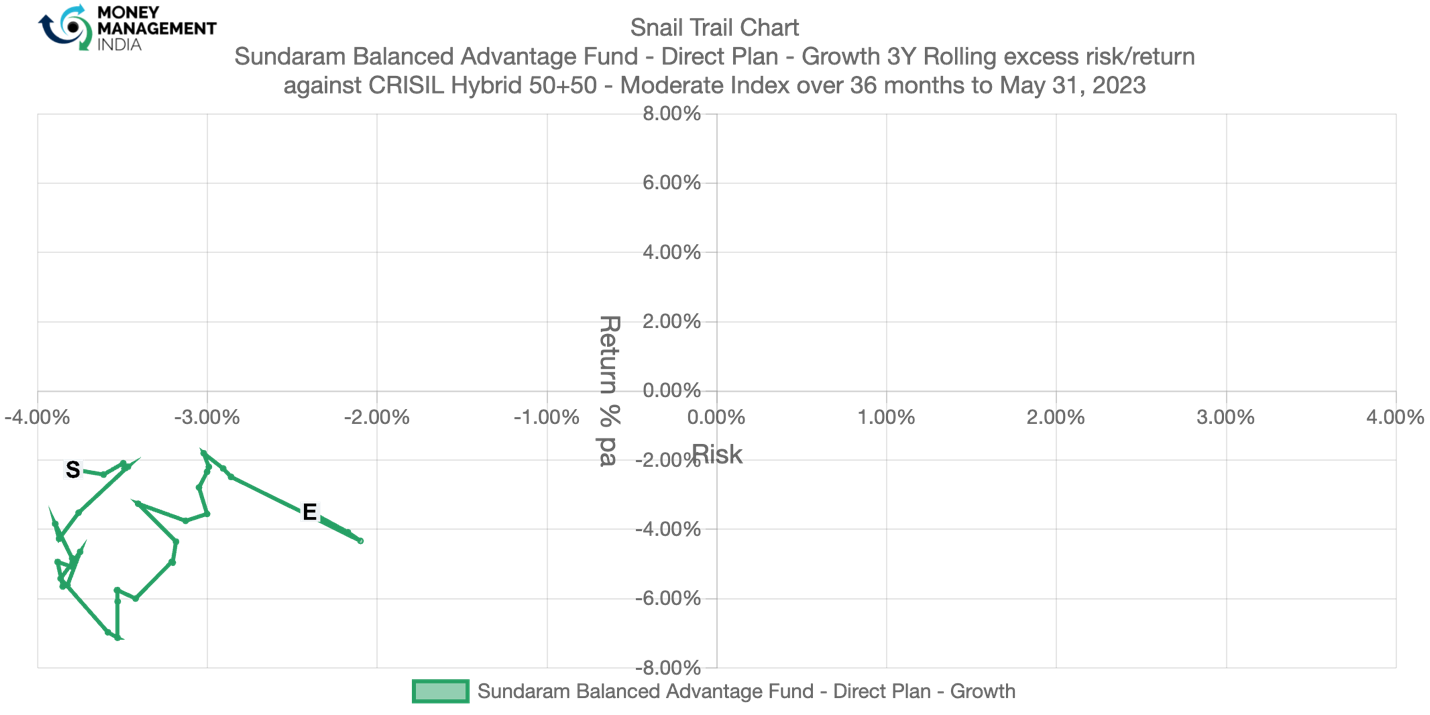
The fund has shown a significant time around -4% to -6% per annum, whilst lower than the index volatility of -4% to -3% per annum. However, in May 2023, the excess returns came down to around -4%. The fund has given negative returns with low volatility.
Tracking error
The tracking error ranges between 1% to 16% for the period May 2020 to May 2023.
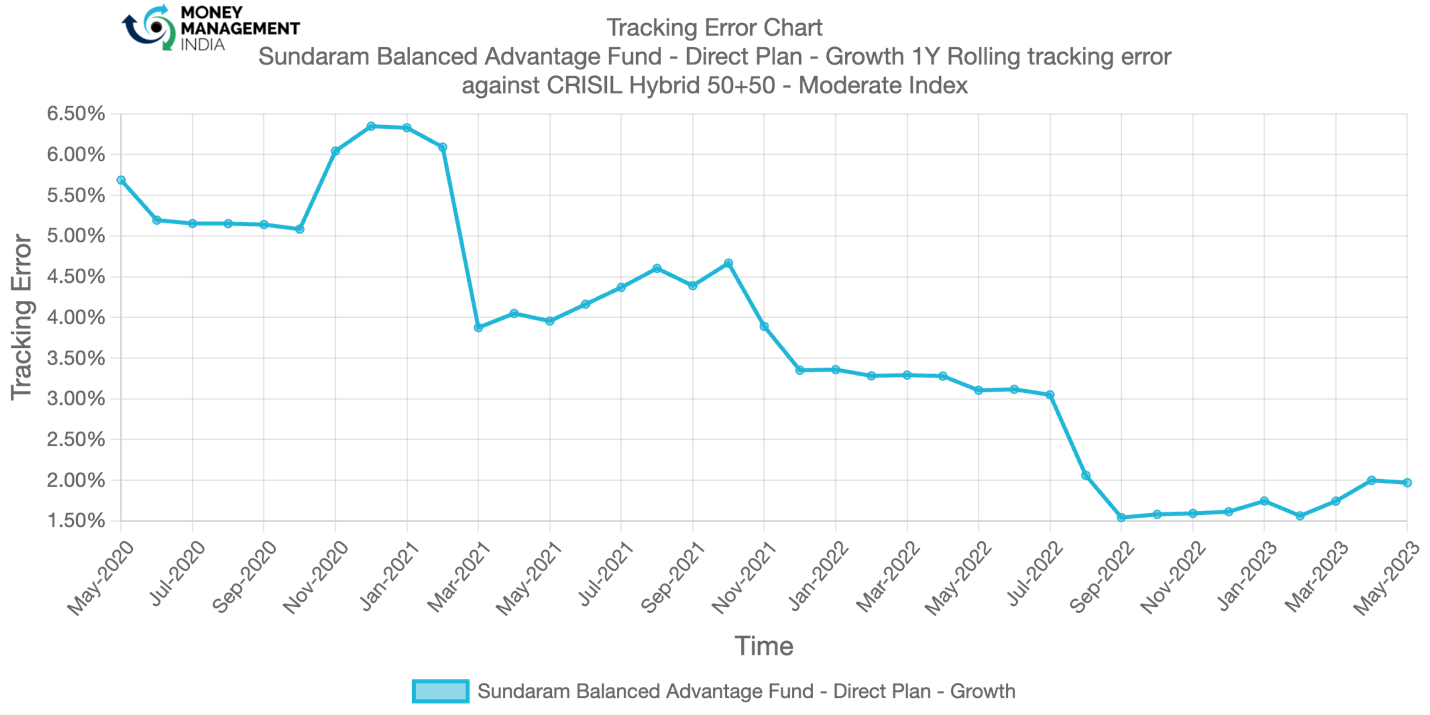
The tracking error was the highest at 6.3% in 2020 – 21. However, in May 2023, the tracking error came down to around 2%. The overall range has been around 6.3% to 1.5%.
Information ratio
The rolling IR has been quite volatile ranging from -5 to 5 making it difficult to discern any skill.
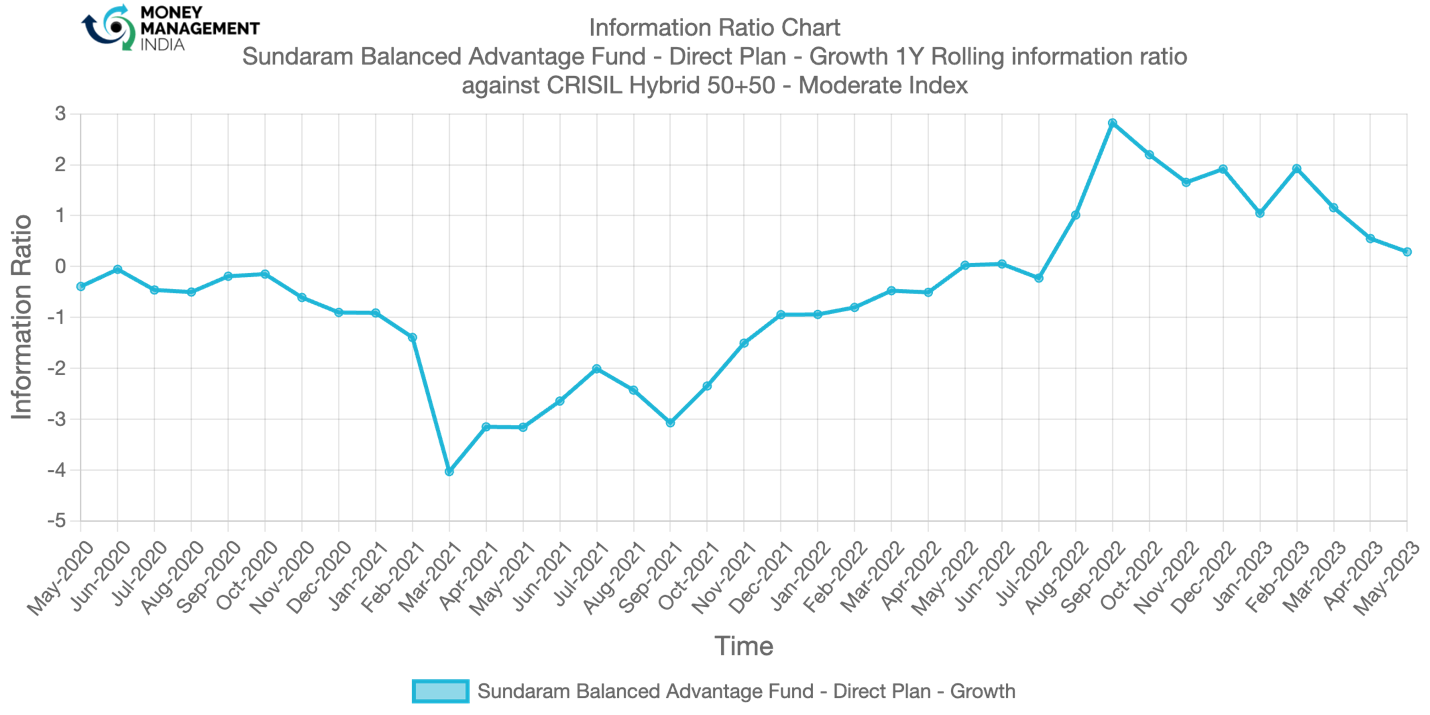
In Sep 2022, the information ratio reached the peak at 3. However, in May 2023, the ratio came down to 0.2 The overall range has been around 3 to -4.
Prepared by – Oraina Dsouza, June 2023
You must be logged in to post a comment.