ISIN
Performance analysis
Rolling returns in quartiles
The 3-year rolling excess median return has gradually come down from around 4% from May 2016 to -1.77% in April 2023. The dispersion between upper and lower quartile is still wide at +12.43% and -7.78% pa.
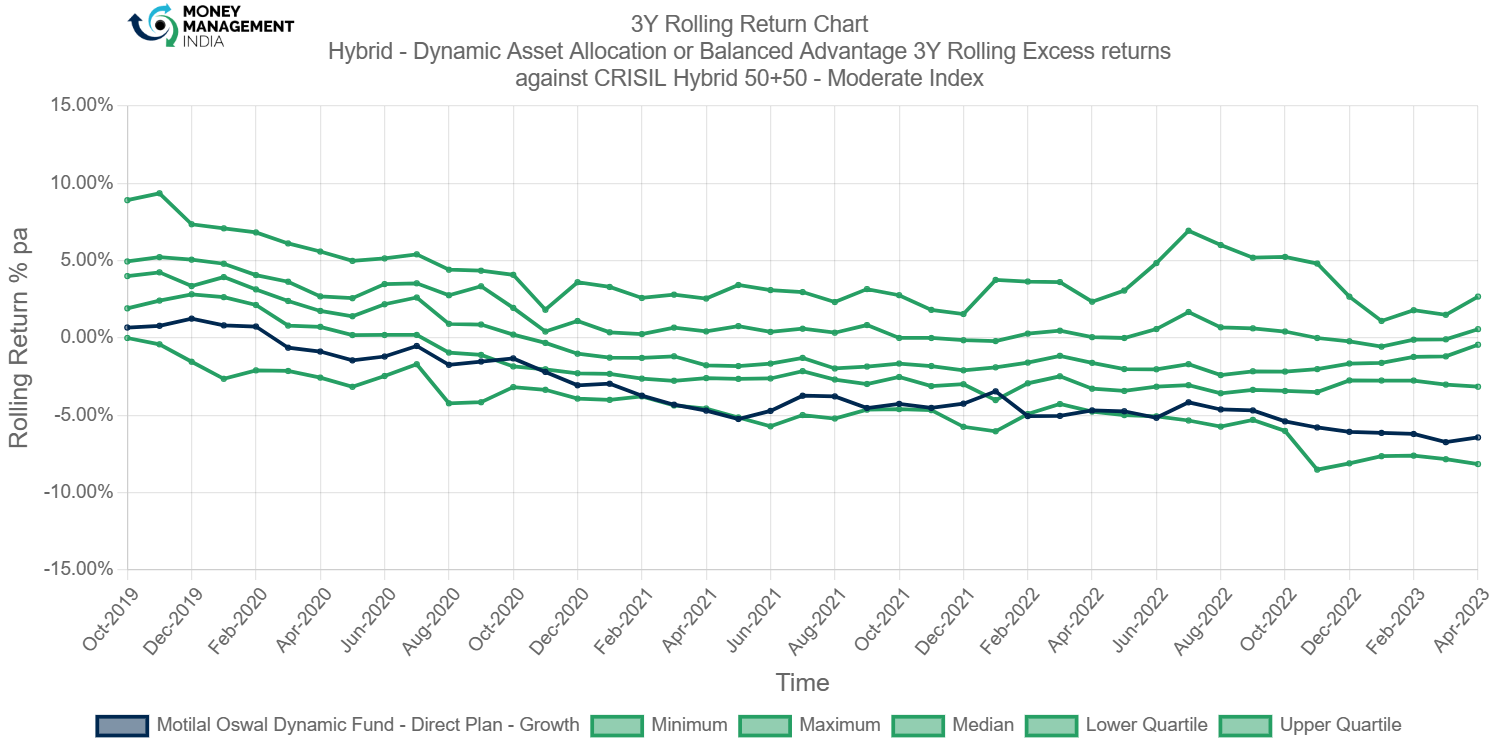
The fund has generated negative excess returns during the period between March 2020 – April 2023. The blue line’s time below the median line indicates that the fund has underperformed the performance of the median.
Rolling risk/return (Snail-trail)
Funds in this category have shown slightly higher (-3.5 to +7) standard deviation compared to the volatility of the index.
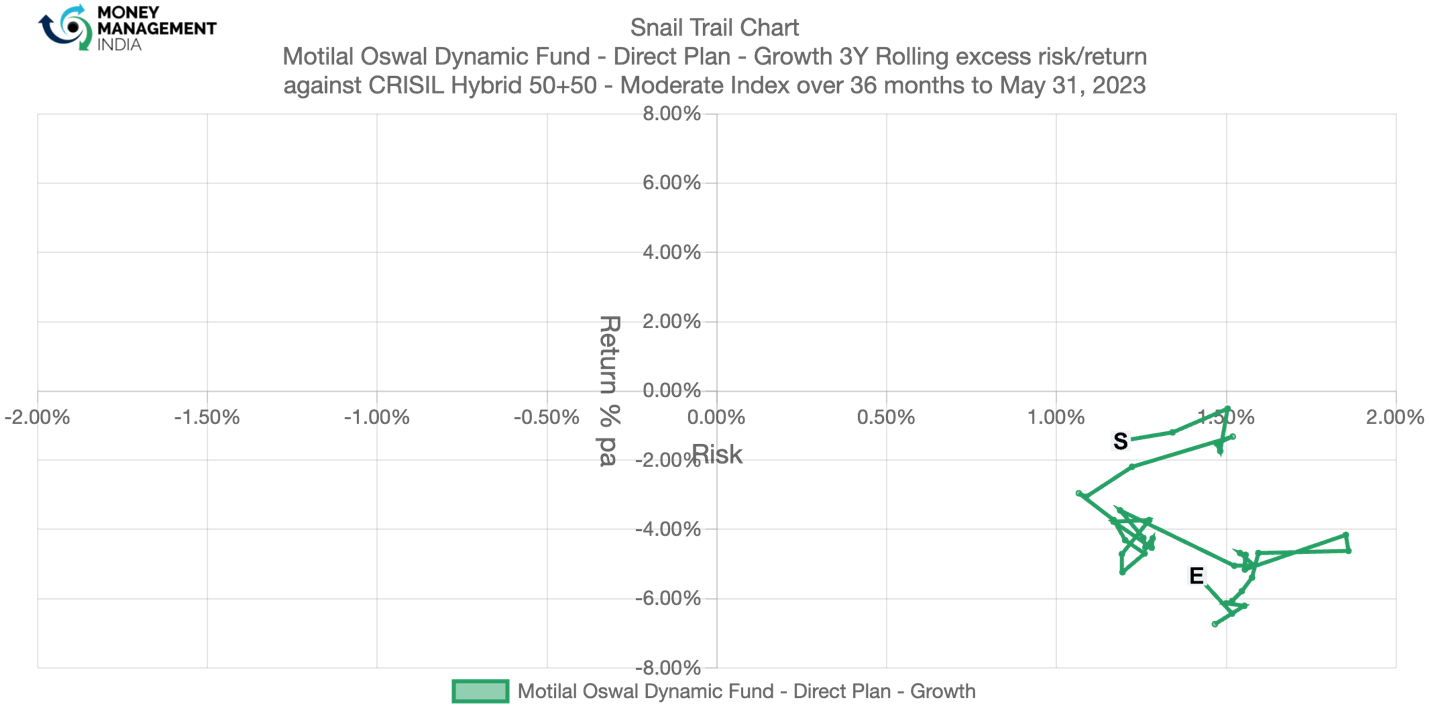
The fund has shown a significant time around -4% to -6% per annum, whilst higher than the index volatility of 1% – 1.5% per annum. However, in May 2023, the excess returns came down to around -5%. The fund has given negative returns with high volatility.
Tracking error
The tracking error ranges between 1% to 16% for the period May 2020 to May 2023.

The tracking error was the highest at 6.5% in 2023. The tracking error has been increasing over the years. The overall range has been around 6.5% to 3.5%.
Information ratio
The rolling IR has been quite volatile ranging from -5 to 5 making it difficult to discern any skill.
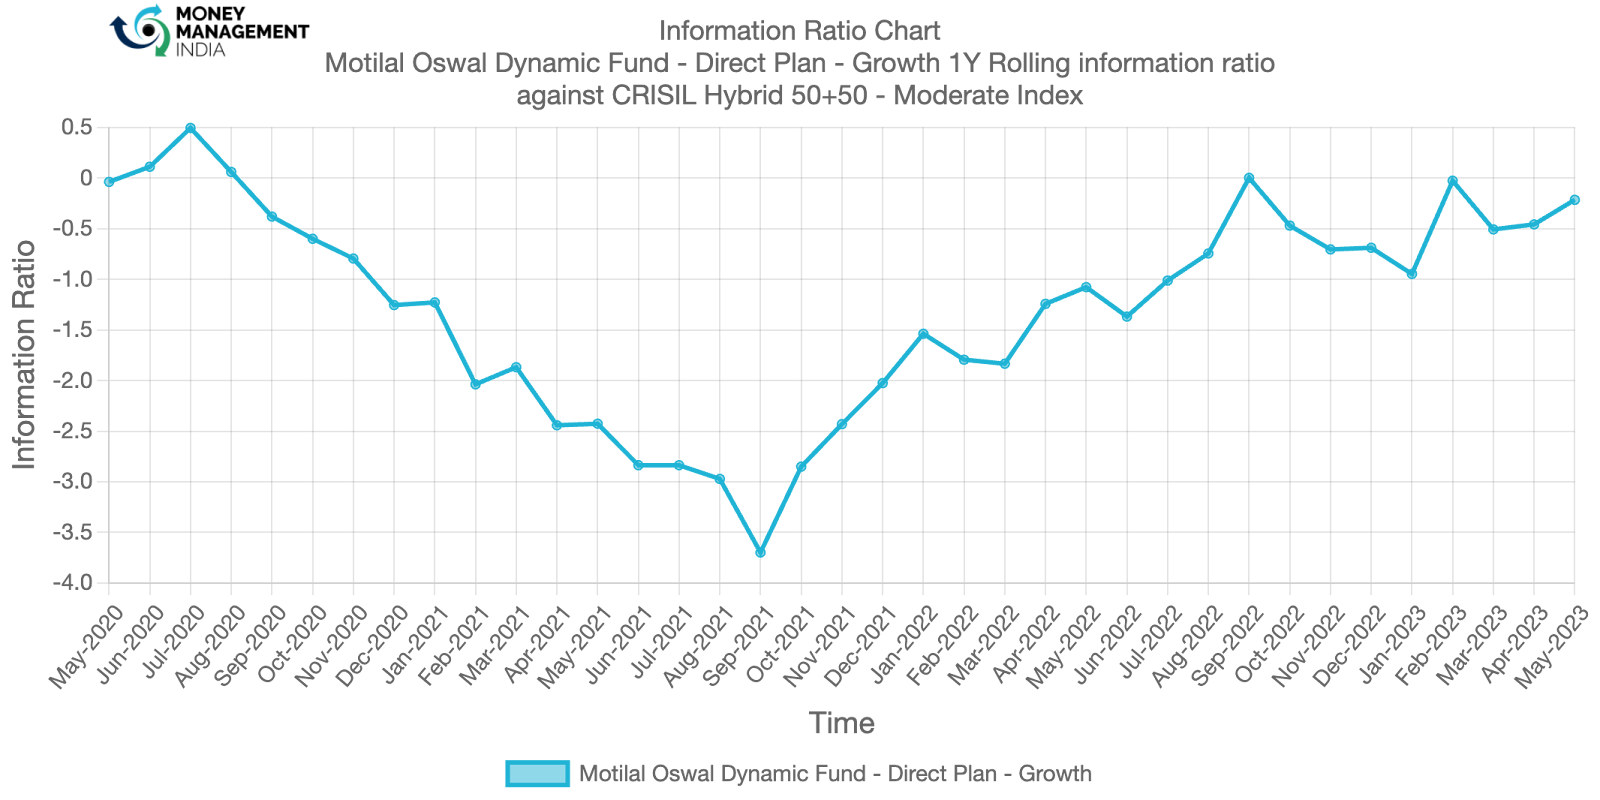
In July 2020, the information ratio reached the peak at 0.5. However, in May 2023, the ratio came down to -0.3 The overall range has been around 0.5 to -3.5.
Prepared by – Oraina Dsouza, June 2023
You must be logged in to post a comment.