ISIN CODE INF917K01FZ1
Overall analysis
3-yr rolling excess returns is in the range of -10-8% and tracking error against benchmarks have been in the 4-6% range which is good overall; but the fund’s performance in the short run has been deteriorating. The fund has given the maximum excess return in comparison to its peers; but it has dropped to below the third line (median) over the past 3.6 years.
Performance analysis
Rolling returns in quartiles
The rolling return chart shows excess 3-year annualised returns in context of peer return quartiles. The blue line’s time above the third green median line indicates the fund’s better than median performance.
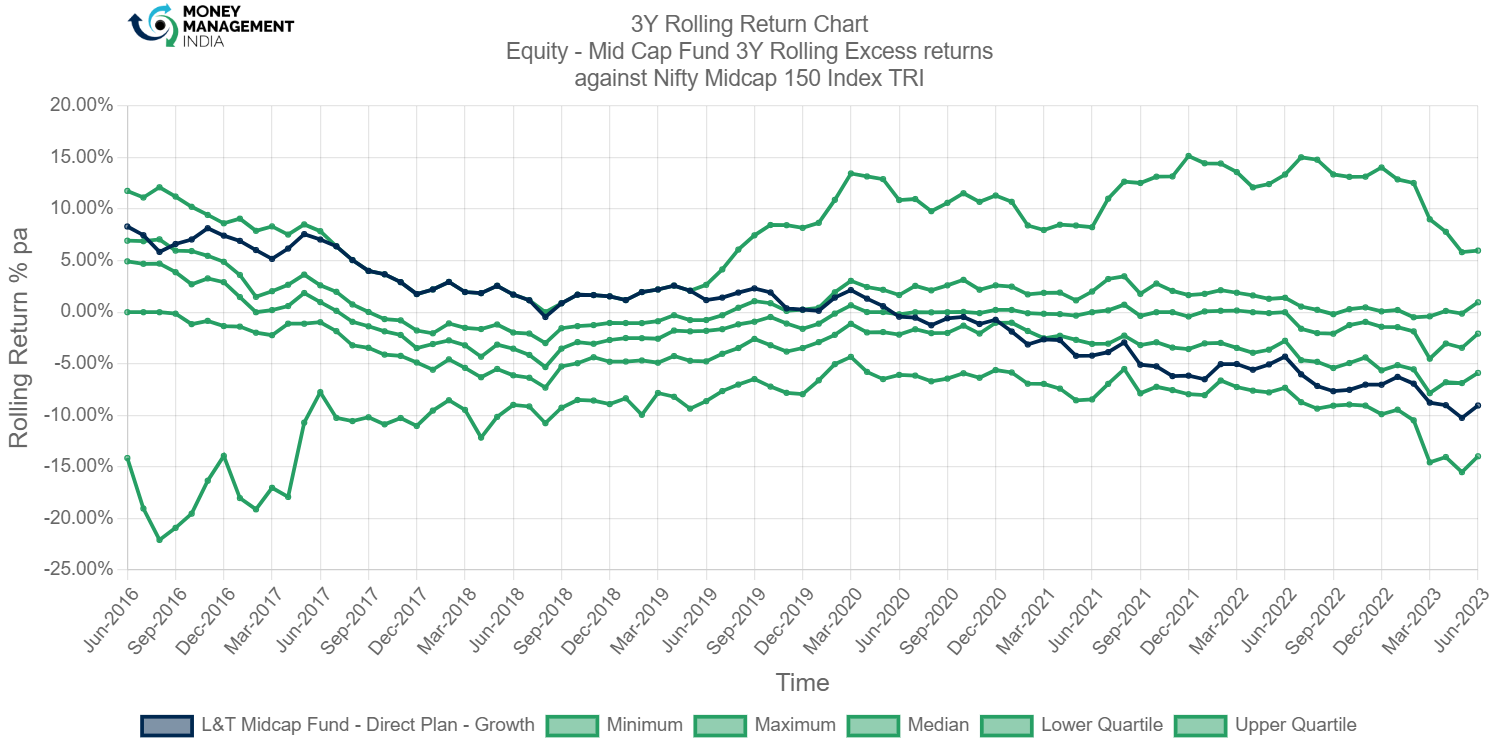
The fund initially outperformed the third green median line, but after June 2020, it has performed low compared to the third green median line. The maximum rolling return is 8.31% and the minimum rolling return is -10.25%.
Rolling risk/return (Snail-trail)
The rolling risk/return chart shows excess 3-year annualised returns relative to the index. The top left quadrant would indicate higher returns with lower volatility than index.
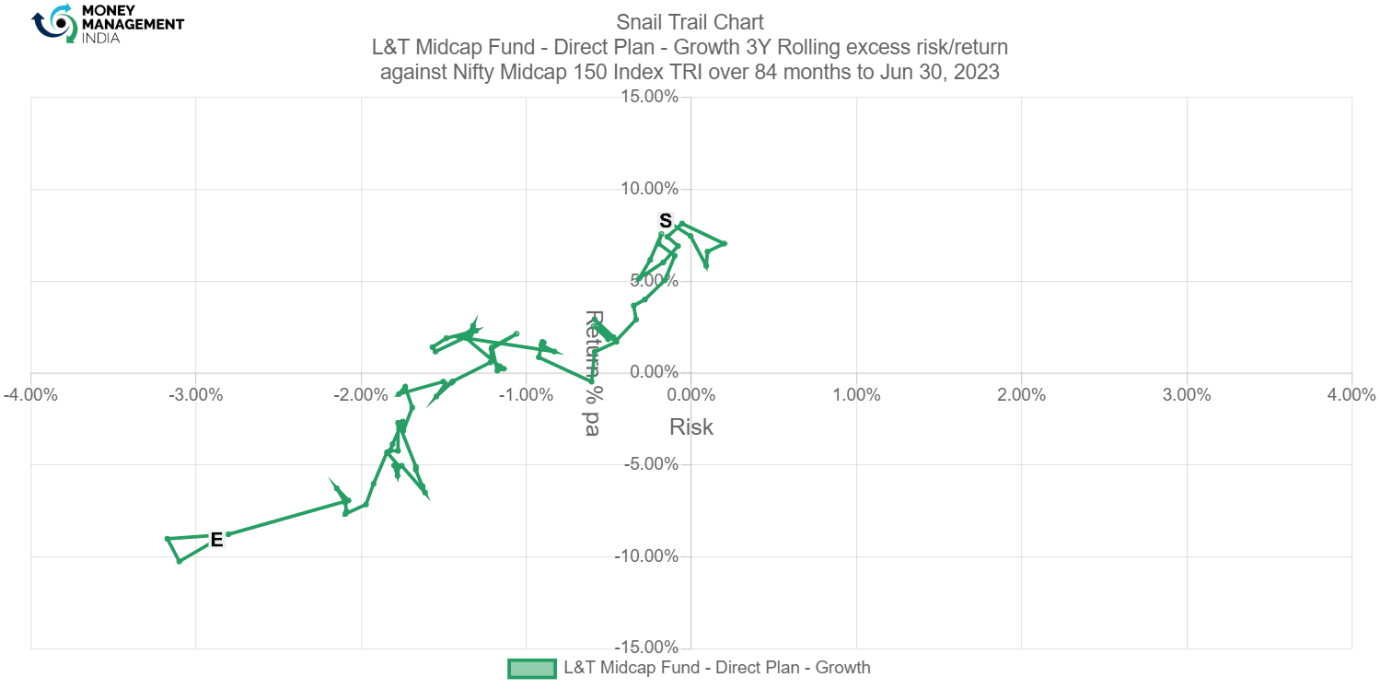
Initially the fund has outperformed benchmark with relatively lower risk but after June 2020 it underperformed benchmark with relatively lower risk.
Tracking error
The tracking error chart shows how the fund ‘tracks’ against the index. The higher the TE, the more active the fund’s return has been, with the 2-4% range considered to be barely active, 4-6% range considered to be reasonably active and anything higher attributed to concentrated/focused funds. Funds with TE of less than 2% can be considered to be closet indexers.
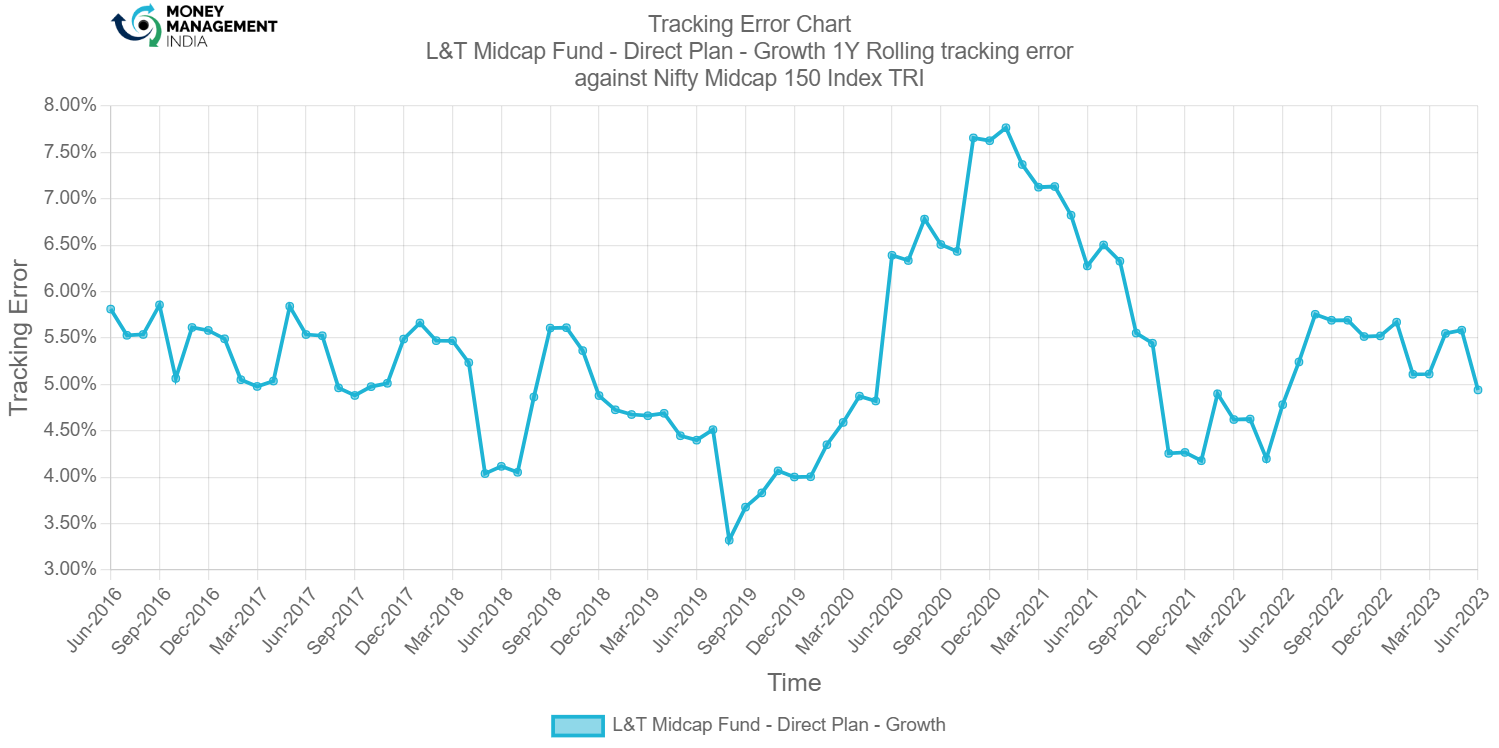
The fund’s tracking error is excellent; it has consistently ranged between 4-6%, which is considered to be a reasonably active range.
Information ratio
The information ratio is a measure of ‘risk-adjusted return’ as it’s the excess return per unit of excess volatility. Active funds should have IR of higher than 1, ideally higher than 1.3 at least to indicate skill.

The funds information ratio was over 1, which was nice at first, but it has been below 1 since May 2017, which is not ideal.
Prepared by Bhavesh Mahajan, Aug 2023.
L&T Midcap Fund – Direct Plan
ISIN CODE INF917K01FZ1
Overall analysis
3-yr rolling excess returns is in the range of -10-8% and tracking error against benchmarks have been in the 4-6% range which is good overall; but the fund’s performance in the short run has been deteriorating. The fund has given the maximum excess return in comparison to its peers; but it has dropped to below the third line (median) over the past 3.6 years.
Performance analysis
Rolling returns in quartiles
The rolling return chart shows excess 3-year annualised returns in context of peer return quartiles. The blue line’s time above the third green median line indicates the fund’s better than median performance.
The fund initially outperformed the third green median line, but after June 2020, it has performed low compared to the third green median line. The maximum rolling return is 8.31% and the minimum rolling return is -10.25%.
Rolling risk/return (Snail-trail)
The rolling risk/return chart shows excess 3-year annualised returns relative to the index. The top left quadrant would indicate higher returns with lower volatility than index.
Initially the fund has outperformed benchmark with relatively lower risk but after June 2020 it underperformed benchmark with relatively lower risk.
Tracking error
The tracking error chart shows how the fund ‘tracks’ against the index. The higher the TE, the more active the fund’s return has been, with the 2-4% range considered to be barely active, 4-6% range considered to be reasonably active and anything higher attributed to concentrated/focused funds. Funds with TE of less than 2% can be considered to be closet indexers.
The fund’s tracking error is excellent; it has consistently ranged between 4-6%, which is considered to be a reasonably active range.
Information ratio
The information ratio is a measure of ‘risk-adjusted return’ as it’s the excess return per unit of excess volatility. Active funds should have IR of higher than 1, ideally higher than 1.3 at least to indicate skill.
The funds information ratio was over 1, which was nice at first, but it has been below 1 since May 2017, which is not ideal.
Prepared by Bhavesh Mahajan, Aug 2023.
You must be logged in to post a comment.