ISIN INF917K01QA1
Overall analysis
3-yr rolling excess returns has crossed 10% in April 2018 and later it came down 7.80% to and TE range is between 4-6% and touched 7.85% in july 2019 which indicates that the fund is active’ also performance in the short run is increasing. The fund had given the higher excess return in comparison to its peers; but has dropped to below the first quartile over the past 1 year.
Performance analysis
Rolling returns in quartiles
The rolling return chart shows excess 3-year annualised returns in context of peer return quartiles. The blue line’s time above the third green median line indicates the fund’s better than median performance.
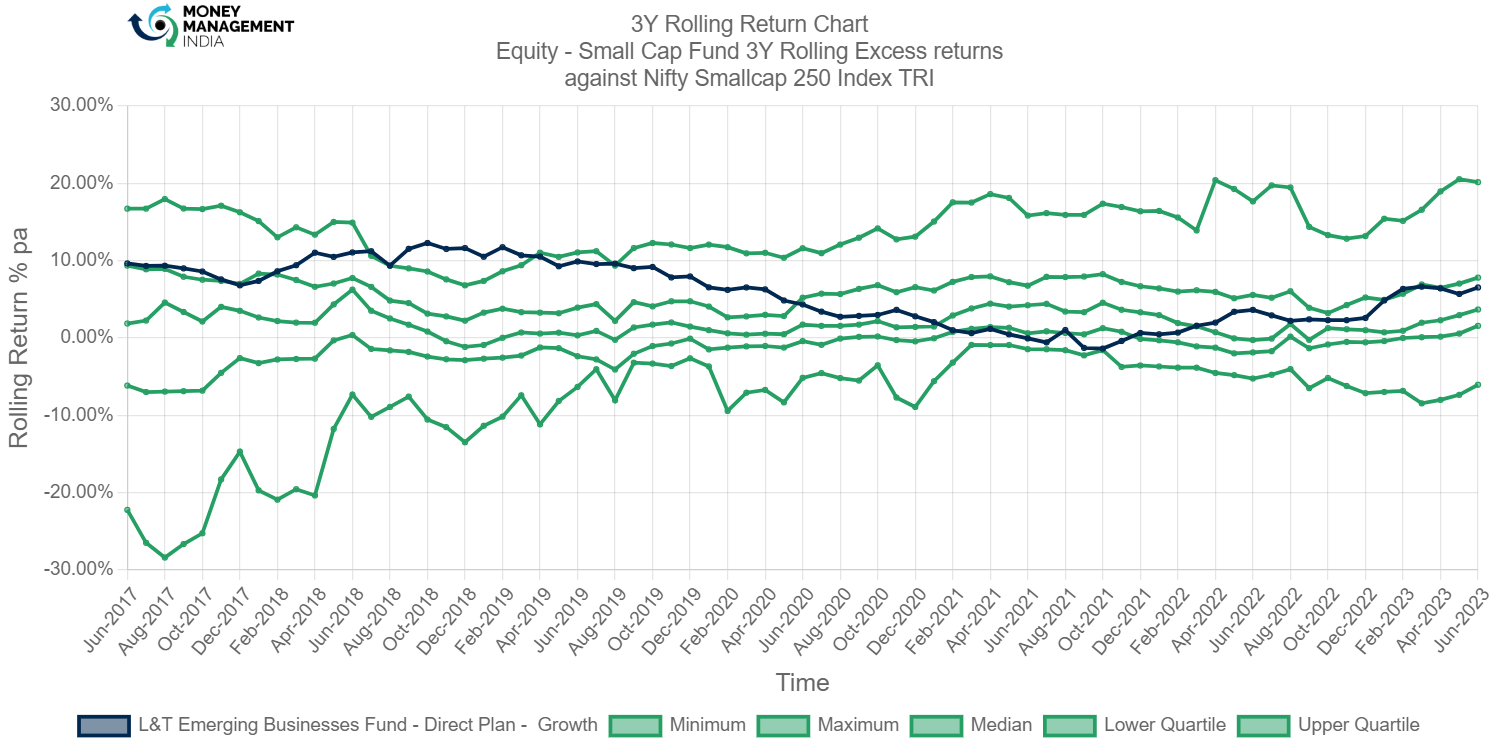
The chart shows that 3-year rolling excess return shows that the blue line is above the green median line indicates that the fund is better than median performance. The fund is above 10% maximum time on the chart.
Rolling risk/return (Snail-trail)
The rolling risk/return chart shows excess 3-year annualised returns relative to the index. The top left quadrant would indicate higher returns with lower volatility than index.
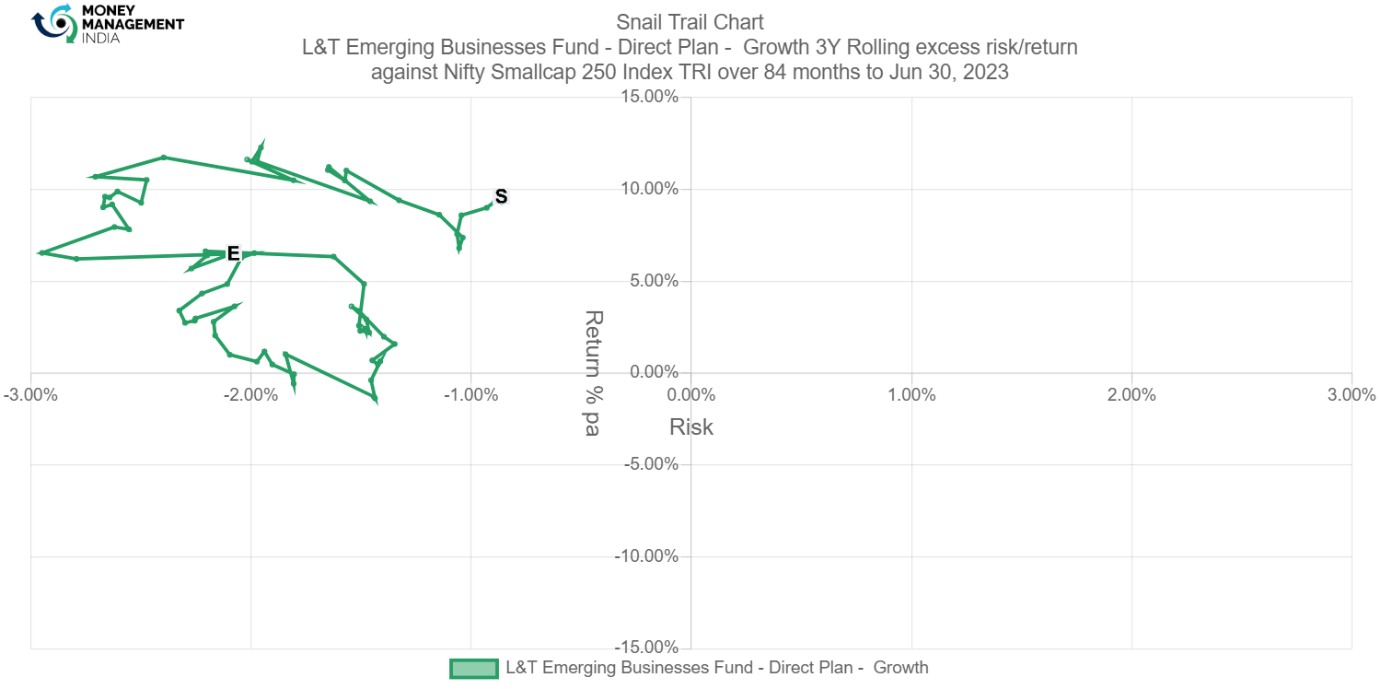
This fund has shown impressive 3-year excess returns, touching 10% per annum and a significant time around the 0-5% per annum, whilst lower than index volatility of 2-3% pa. However, the excess return came down to around 2% towards the end of 2023.
Tracking error
The tracking error chart shows how the fund ‘tracks’ against the index. The higher the TE, the more active the fund’s return has been, with the 2-4% range considered to be barely active, 4-6% range considered to be reasonably active and anything higher attributed to concentrated/focused funds. Funds with TE of less than 2% can be considered to be closet indexers.
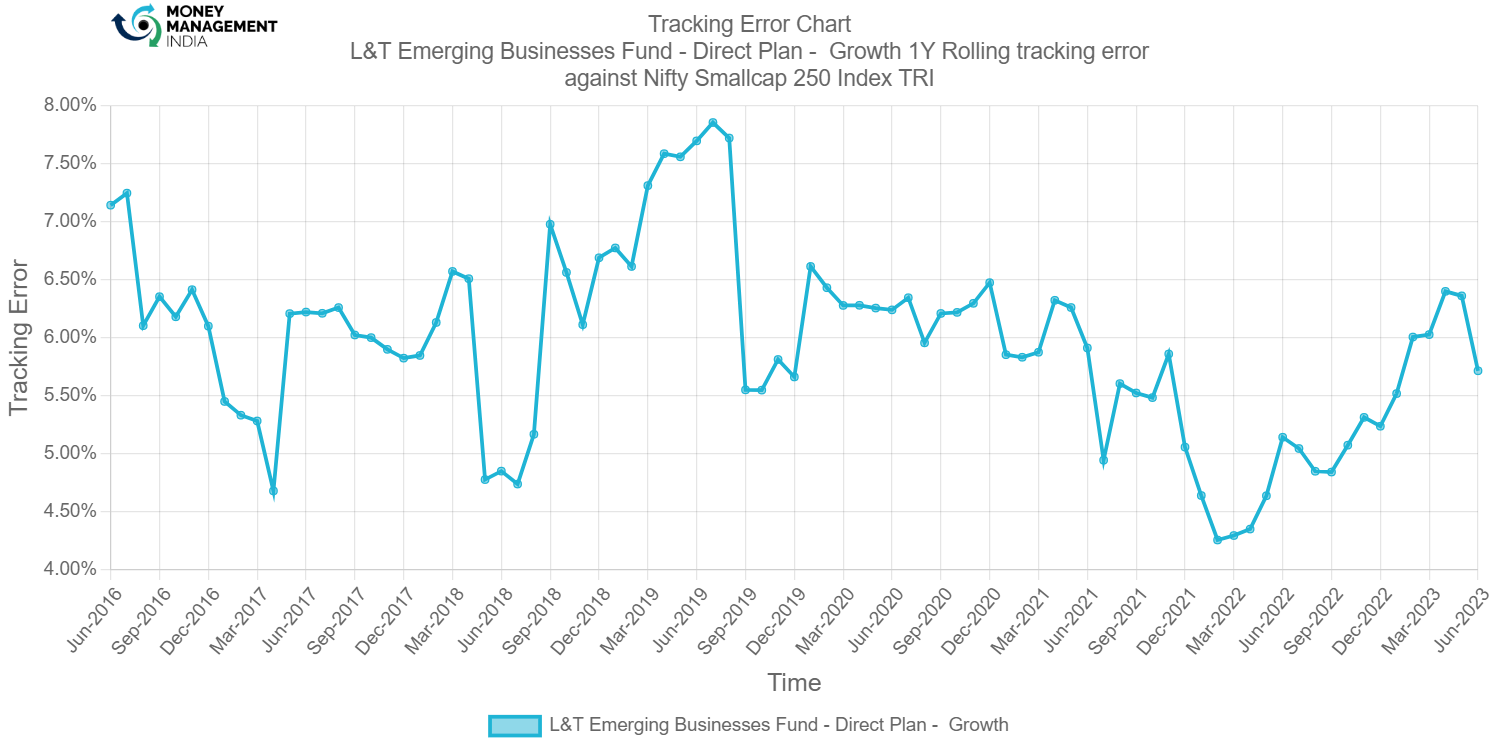
The tracking error chart shows that the range of fund is 5-6% maximum time of graph, which indicates the fund has performed well and it is reasonably active.
Information ratio
The information ratio is a measure of ‘risk-adjusted return’ as it’s the excess return per unit of excess volatility. Active funds should have IR of higher than 1, ideally higher than 1.3 at least to indicate skill.

The information ratio chart ranges maximum time between 1-2, which indicates the fund is ideal. The fund has fallen down after February 2021, and in June, 2023 it came to 0.67.
Prepared by – Dhruvi Shah, August 2023
You must be logged in to post a comment.