INF174K019S9
Overall analysis
3-years rolling excess returns of the fund has crossed down the maximum line, it gave the maximum return in comparison to its peers. Overall, this fund has good TE, it is moderately active. It has negative IR & has generated decent returns to its investors by taking the least risk against benchmark.
Performance analysis
Rolling returns – 3 years rolling excess returns over 5 years
Snail trail – 3 years rolling excess risk/return over 5 years
Tracking error – 1yr rolling tracking error
Information ratio – 1yr rolling information ratio
Rolling returns in quartiles
The rolling return chart shows excess 1Y-year rolling return in context of peer return quartiles. The blue line’s time above the third green median line indicates the fund’s better than median performance.

3 years rolling excess returns shows that the fund has performed great against Nifty 500 multicap 50:25:25 total return index & also against its peers. From March 2021 to February 2023, it stayed above the maximum (green) line touching the highest excess returns of 10.29% in the month of February 2023, and fell down further till the low of 3.58%, but after all the fund rolling returns has excess returns over its competitors. Currently it stands at 4.55% as of June 2023.
Rolling risk/return (Snail-trail)
The rolling risk/return chart shows excess 1-year annualized returns relative to the index. The top left quadrant would indicate higher returns with lower volatility than index.

According to the 3 years rolling excess risk/return chart the fund had a positive start; it generated 3 years rolling returns of 5.3% taking lesser & negative risk of -2.5% against benchmark, and achieved the high of 10.29%. Most of the time the snail trail indicator is around the top left quadrant which means the fund took negative risk to generate positive returns over its benchmark. Currently in June 2023 the snail trail indicator is moving towards the top right quadrant (taking positive risk and generating positive returns), fund took the risk of 0.01% and generated return of 4.5%.
Tracking error
The tracking error chart shows how the fund ‘tracks’ against the index. The higher the TE, the more active the fund’s return has been, with the 1-3% range considered to be low TE, 3-6% range considered to be moderately active and anything higher than 6% is high TE. Funds with TE of less than 2% can be considered to be closet indexers.
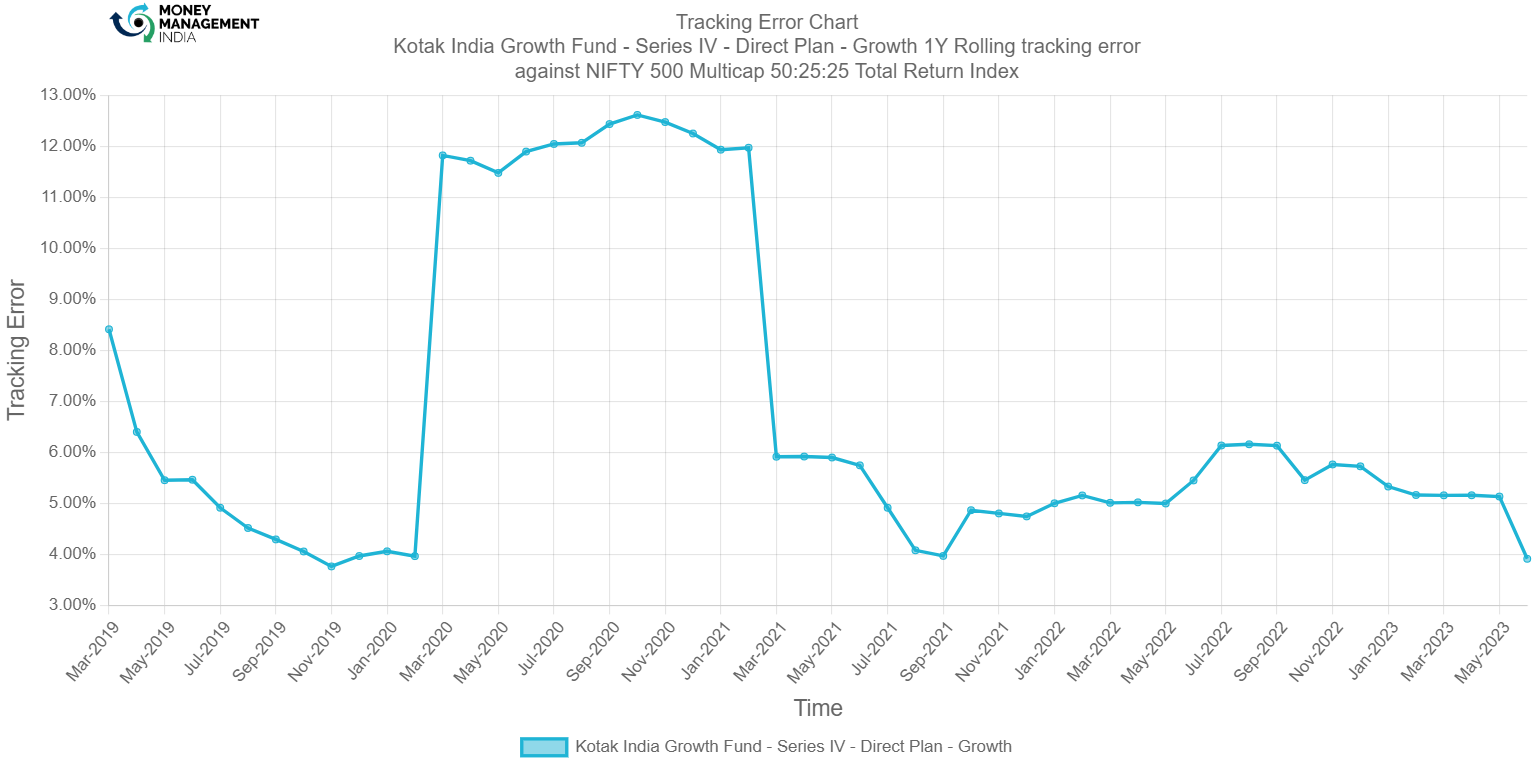
Tracking error chart shows that the fund has its frequent TE footsteps around 4% to 6% approx. which means moderately active. In March 2020 the fund was aggressively active with the TE of 11.8% moving to the maximum 1 year rolling tracking error level of 12.6% in October 2020 which is a massive TE. Now in June 2023 it stood at 3.9%.
Information ratio
The information ratio is a measure of ‘risk-adjusted return’ as it’s the excess return per unit of excess volatility. Active funds should have IR of higher than 1, ideally higher than 1.3 at least to indicate skill.

1 year rolling Information ratio is -0.05 as of May 2023 against its benchmark, fund has the highest IR level of 2.6 & lowest of -1.5, thus the fund has been through both positive & negative IR but maximal time it has slightly +ve IR against its benchmark.
Prepared by – Hemanth Reddy, August 2023
You must be logged in to post a comment.