INF194K01W62
Overall analysis
The 3-yr rolling excess return tracking error against benchmark has been bad overall. When the fund was started that time, it gave a positive return and after 20117 fund was given negative return. So ideally a fund is not good for investment.
Performance analysis
Rolling return in quartiles
The rolling return chart shows excess 3-year annualised returns in context of peer return quartiles. The blue line’s time above the third green median line indicates the fund’s better than median performance.

3 years of rolling return only one time in 2016 the fund was touched to 10% and after February 2018 it was continued in negative.
Rolling Risk/return (snail-trail)
The rolling risk/return chart shows excess 3-year annualised returns relative to the index. The top left quadrant would indicate higher returns with lower volatility than index.
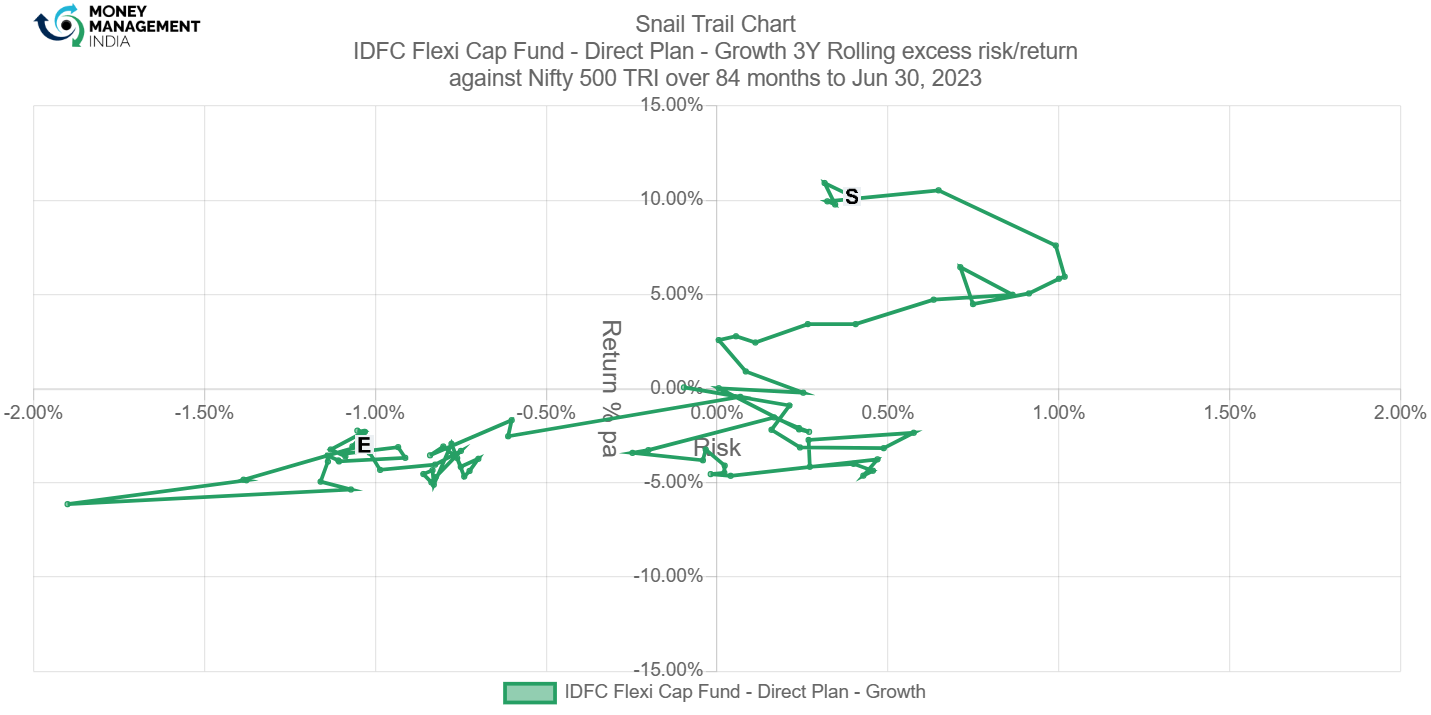
In the Snail Trail Chart, we clearly saw in 2016 and 2017 only two years were good after this time it was on average and negative.
Tracking error
The tracking error chart shows how the fund ‘tracks’ against the index. The higher the TE, the more active the fund’s return has been, with the 3-6% range considered to be barely active, >6% range considered to be reasonably active and anything higher attributed to concentrated/focused funds. Funds with TE of less than 3% can be considered to be closet indexers.

The Tracking error of this fund was maintained between 7% to 4%. Once in February to June 2019 it was nearly 2% after this fund was going up.
Information ratio
The information ratio is a measure of ‘risk-adjusted return’ as it’s the excess return per unit of excess volatility. Active funds should have IR of higher than 1, ideally higher than 1.3 at least to indicate skill.
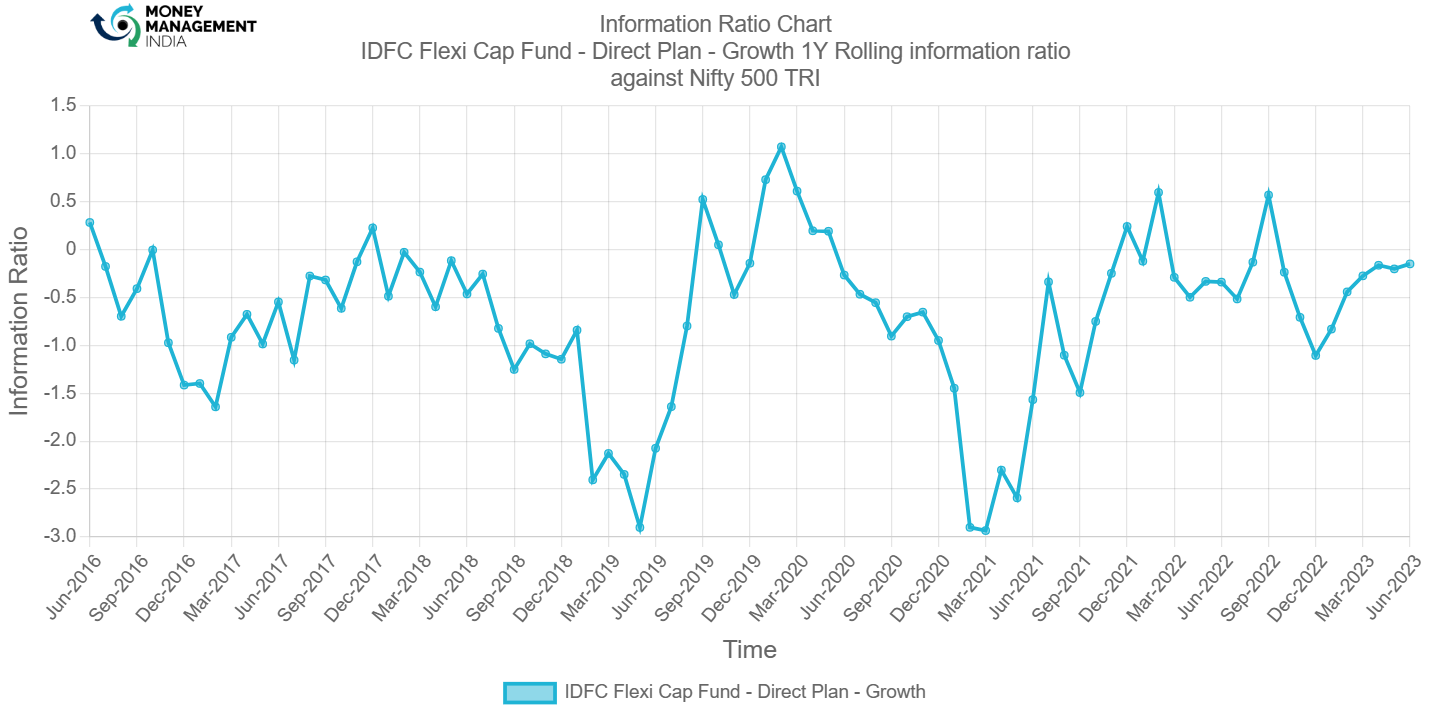
IDFC Flexi Cap Fund Information Ratio most of the time was less than 1, It was not satisfying for the fund.
Prepared by – <Nisarg Patel>, August 2023
You must be logged in to post a comment.