ISIN CODE INF179K01XQ0
Overall analysis
3-yr rolling excess returns is in the range of -2-7% and tracking error against benchmarks have been in the 2-4% range which is good overall; but the funds’ performance in the short run has been deteriorating. The fund has given the maximum excess return in comparison to its peers.
Performance analysis
Rolling returns in quartiles
The rolling return chart shows excess 3-year annualised returns in context of peer return quartiles. The blue line’s time above the third green median line indicates the fund’s better than median performance.
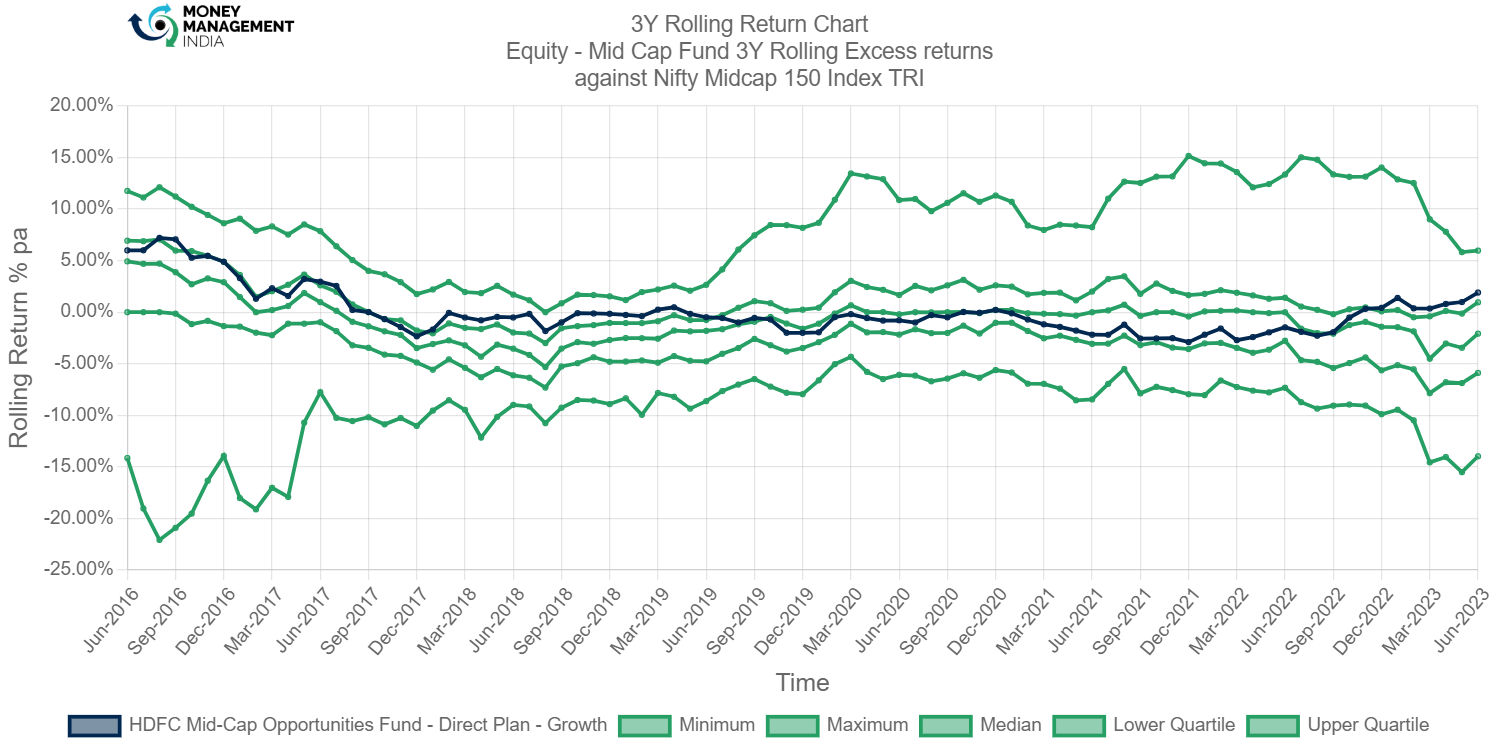
The third green median line was initially outperformed by the fund at first, but after October 2019 it crossed the line, indicating poor performance. After that, in October 2022, it once more passed the median line and the fourth upper quartile line, indicating the fund was performing well. The fund’s maximum rolling return is 7.21% and the minimum rolling return is -2.90.
Rolling risk/return (Snail-trail)

After September 2017, the fund underperformed the benchmark while still carrying a reasonably modest risk compared to its initial performance. However, it beat the benchmark with comparatively reduced risk after November 2022.
Tracking error
The tracking error chart shows how the fund ‘tracks’ against the index. The higher the TE, the more active the fund’s return has been, with the 2-4% range considered to be barely active, 4-6% range considered to be reasonably active and anything higher attributed to concentrated/focused funds. Funds with TE of less than 2% can be considered to be closet indexers.

The overall TE of the fund is in the 4-6% area, which is regarded as reasonably active, although occasionally the TE of the fund has dropped to the 2-4% range.
Information ratio
The information ratio is a measure of ‘risk-adjusted return’ as it’s the excess return per unit of excess volatility. Active funds should have IR of higher than 1, ideally higher than 1.3 at least to indicate skill.
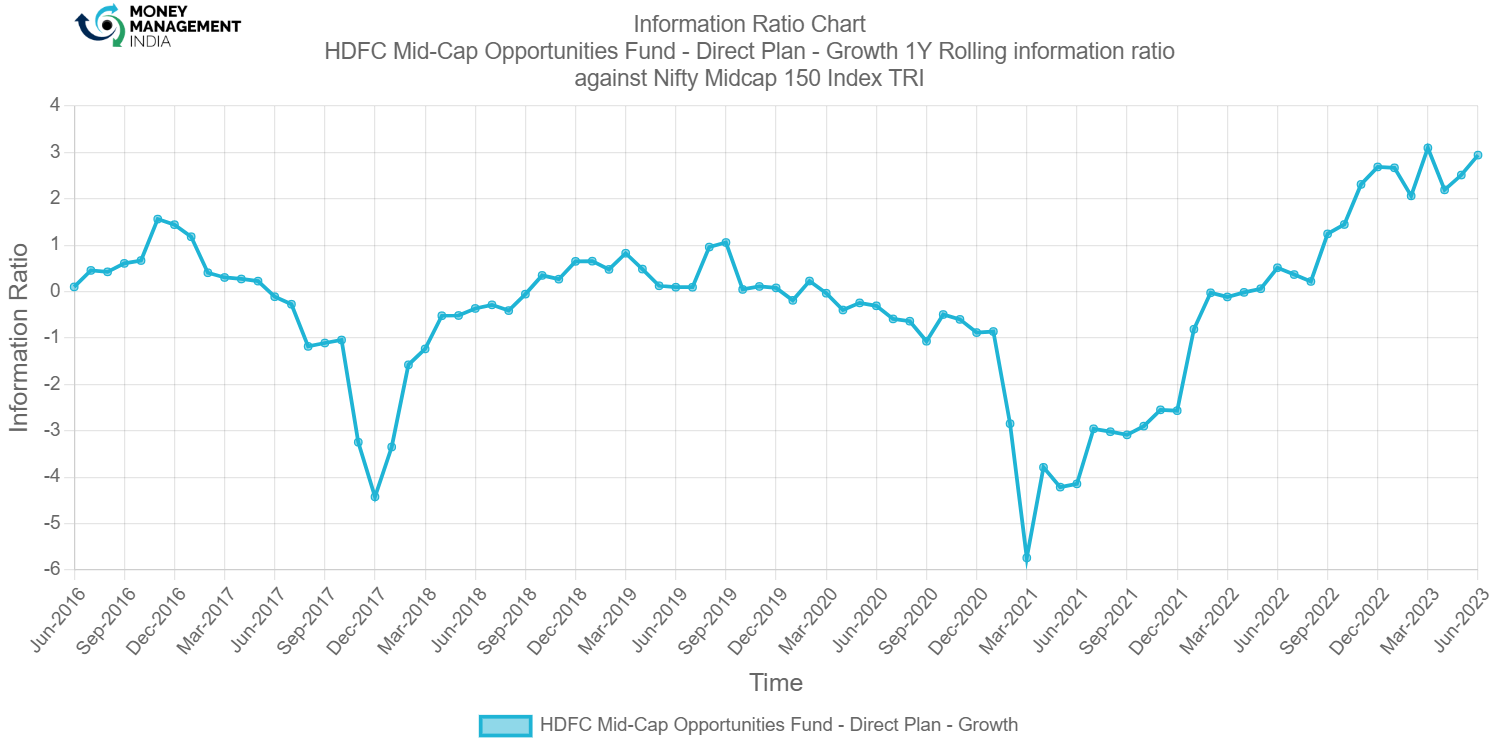
Initially, the fund’s information ratio was quite low; as of Mar 2021, it was -5.7; but, as of Sep 2022, it has increased over 1, which is good.
Portfolio analysis
Stock style chart
Morningstar’s stock style chart shows the ‘style’ of the stocks in the portfolio in terms of size and value/growth style. The centroid shows the weighted average while the zone circle shows how varied the stock styles are.
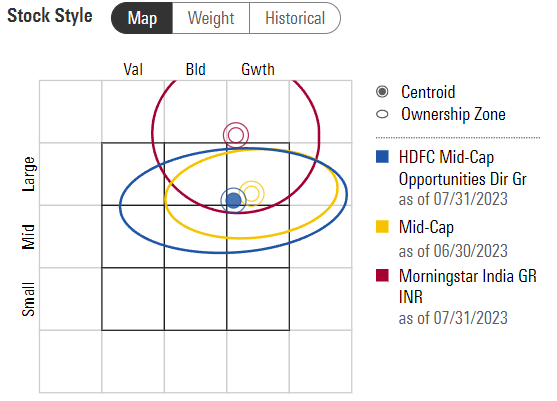
The stock style chart shows that the fund is typically a Large Cap growth fund.
Factor profile chart
Morningstar’s factor profile shows the historical style analysis of the stocks in the portfolio in terms of size, value/growth style and other key factors. The blue circle shows the fund relative to the black dot for the category average.

Prepared by Bhavesh Mahajan, Aug 2023.
You must be logged in to post a comment.